Create a Widget
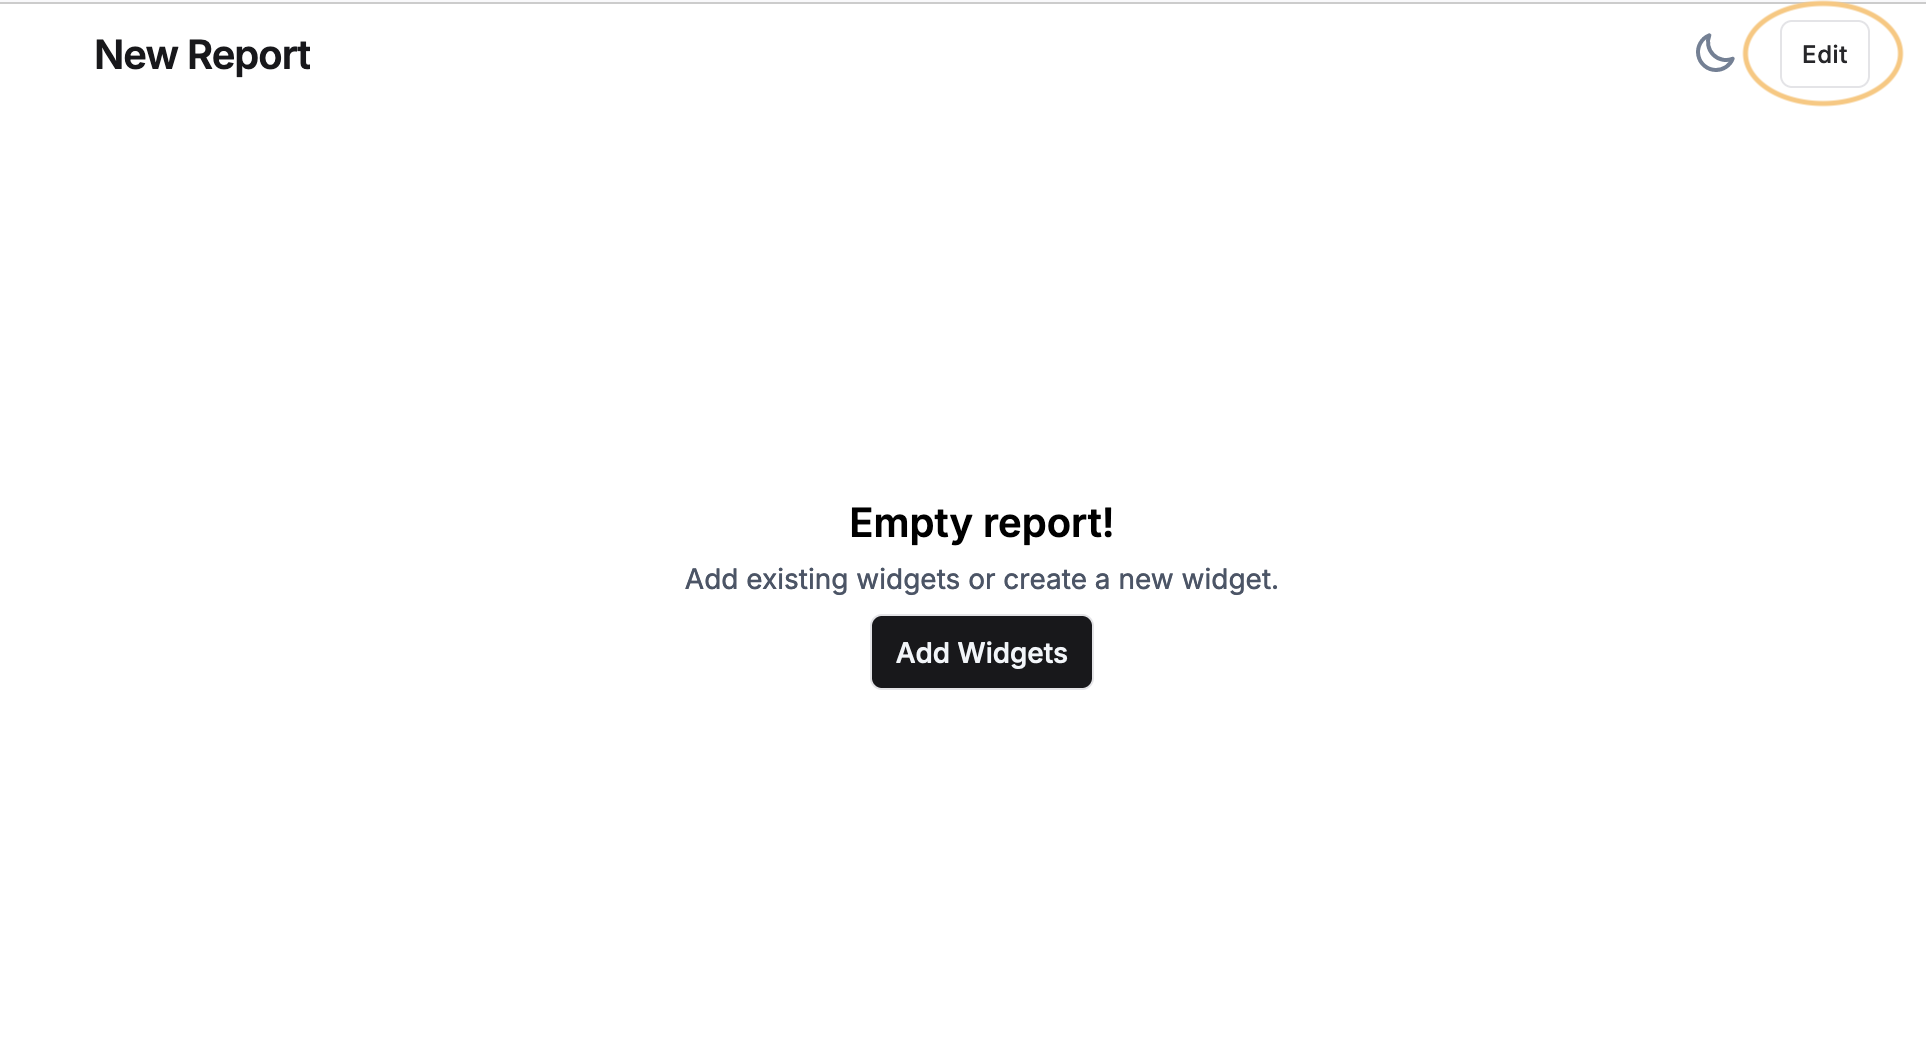
After you've created a new report, you can start adding widgets to the report.
Here's a guide on how to create widgets.
Available Widget Types:
| Text Widget | Allows you to add descriptive text elements to provide context or instructions within your report. Pressing the '/' key or selecting text reveals more options to format the text. |
| Filter Widget | Allows you to add filters to all the widgets within the report. You can only add Filter Widget after you've added at least one other widget to your report. |
| Chart Widgets | Allows you to create visual representations of your data using various chart types. |
| Compare Widget | Allows you to visually compare multiple products side-by-side using existing graph widgets within the template report. |
Add Text widget or Filter Widget:
-
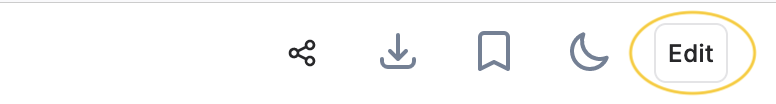
Click on the “‘Edit” button.
-
Click on the down arrow next to the "Add Widget" to choose Text Widget or Filter Widget from the menu.
-
For Filter Widget: Choose required filters from the "Create Filter Widget" dialog.
Add chart Widgets:
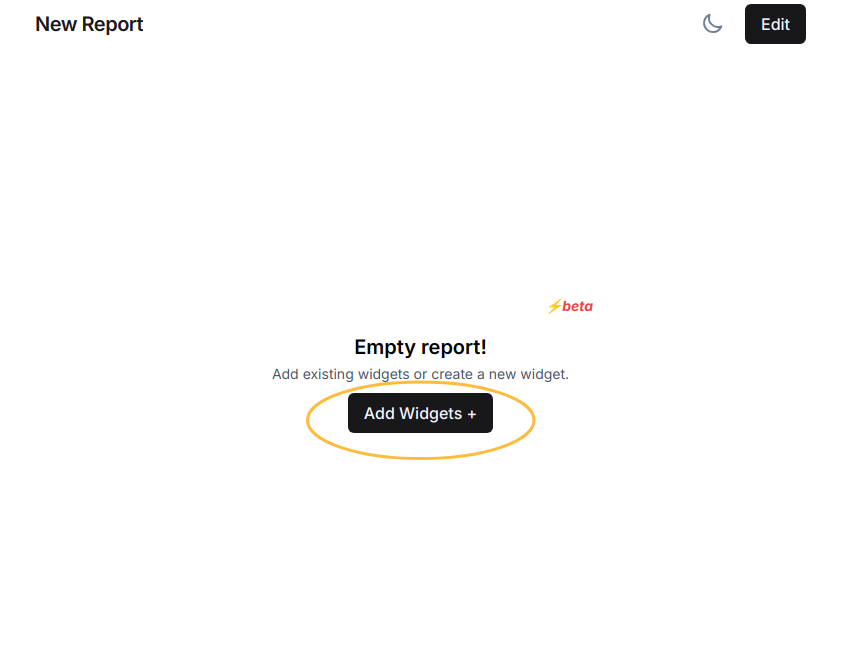
1. Click on "Add Widget"
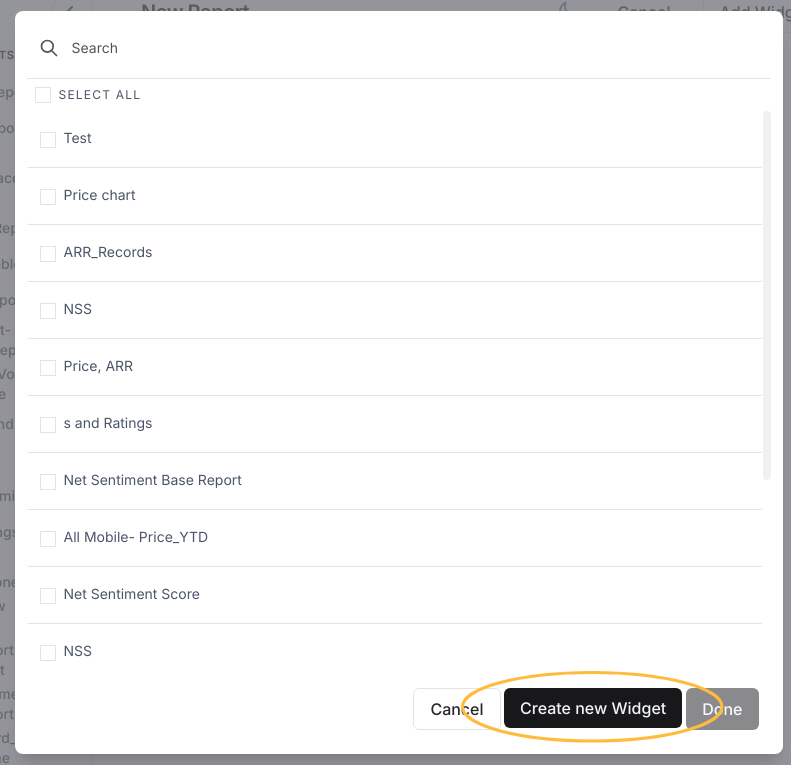
Click on the "Add Widget" button in the center of the page. This will open a modal with all the existing widgets that can be added to the report.
2. Create New Widget
If you'd like to create a new widget, click on "Create New Widget" button. (Or you can add widgets from the existing list of widgets available.)
Clicking on the "Create New Widget" button will take you to the widget builder page.
3. Build Widget
The widget builder provides loads of flexible features to help build the perfect visualization.
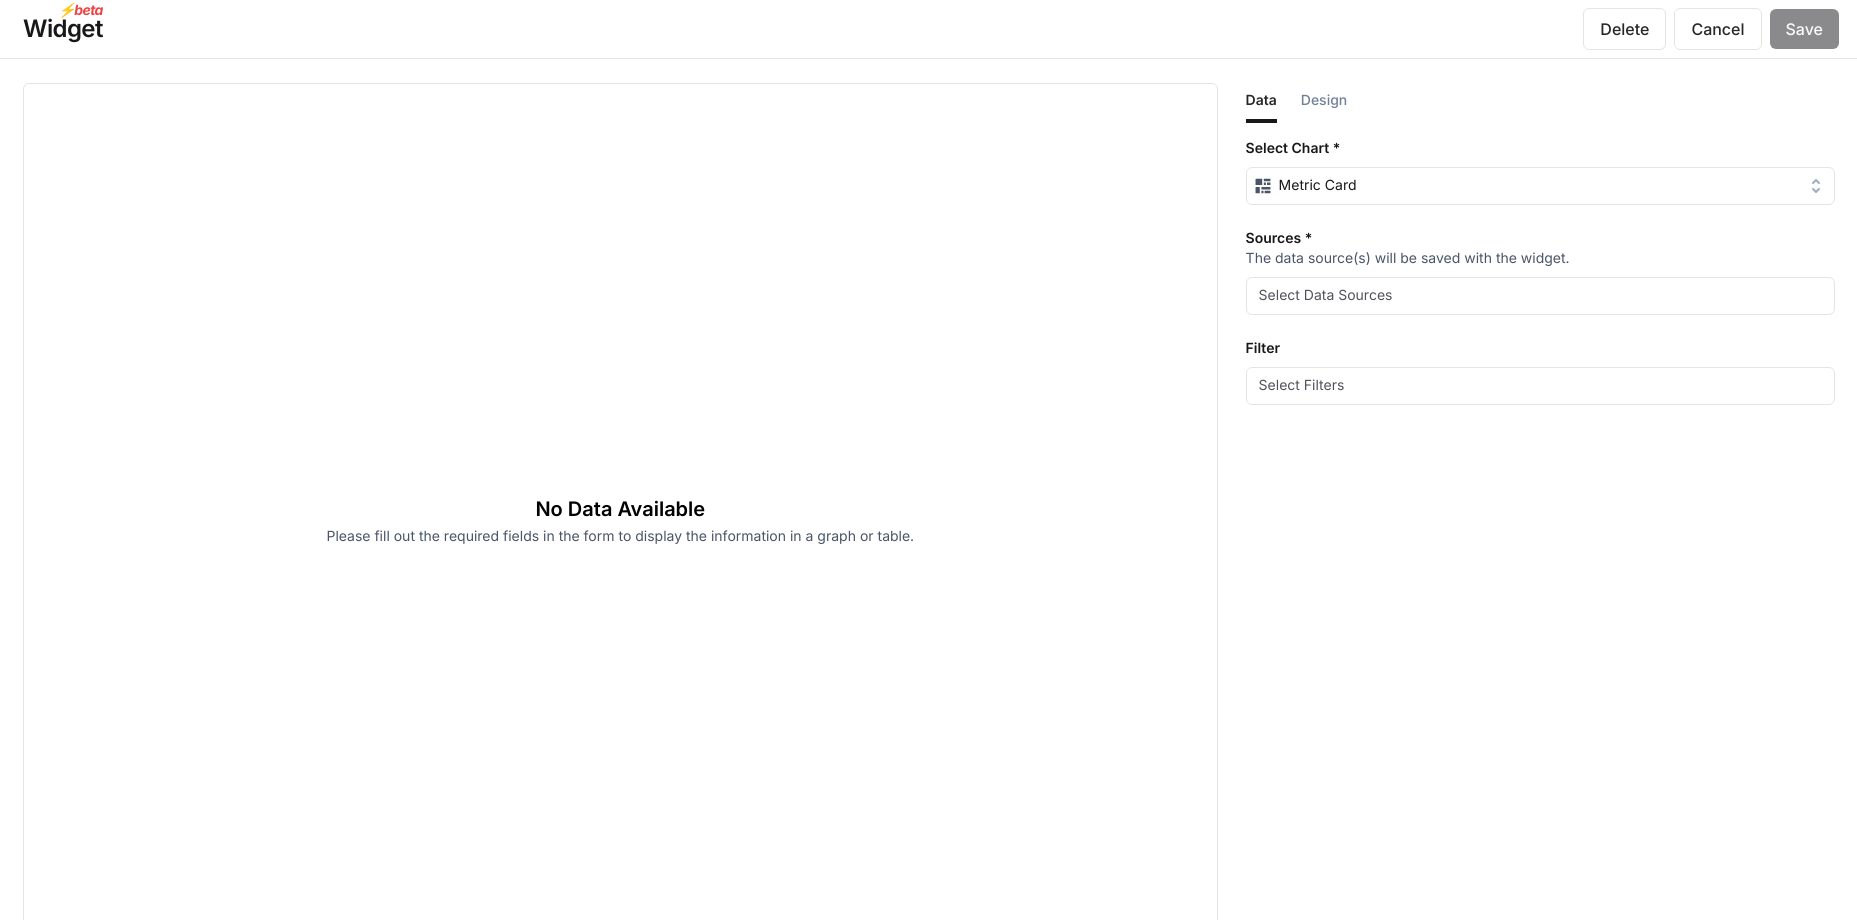
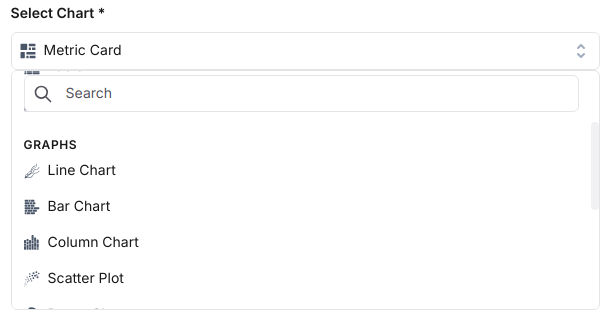
3a. Select 'Chart Type'
You can select a chart type from many options - graphs, tables and custom charts.
3b. Select 'Data Source'
Next, select the data source for the widget from the list of sources that you've added.
If you're building an instance report, the data source will be saved with the widget.
If you're building a template, the data source will not be saved (since the template can be used with any data source).
3c. Apply Filters
From the filters section, apply relevant filters. For e.g if you're visualizing 'top negative sentiment drivers', you may want to filter for 'negative sentiment'.
3d. Widget Name
Give the widget a unique, descriptive name.
3e. Metrics & Dimensions
Once you've picked data sources and applied filters, you need to pick the metrics and dimensions to create the visualization.
| Type | Definition | Examples |
|---|---|---|
| Metrics | Metrics are numerical measurements that represent different aspects of business. They provide specific data points like sales revenue, website traffic, customer satisfaction scores, or inventory levels. | Visits, Rating, Sentiment Score, etc |
| Dimensions | Dimensions are characteristics that add context to your metrics. They help categorize and group data for analysis. Dimensions can be time (dates or months), geographical location, product categories, customer segments, or marketing channels. | Country, City, Gender, etc |
Once these details are provided, the visualization should show up. Continue to iterate or click "Save" to add the widget to the dashboard.
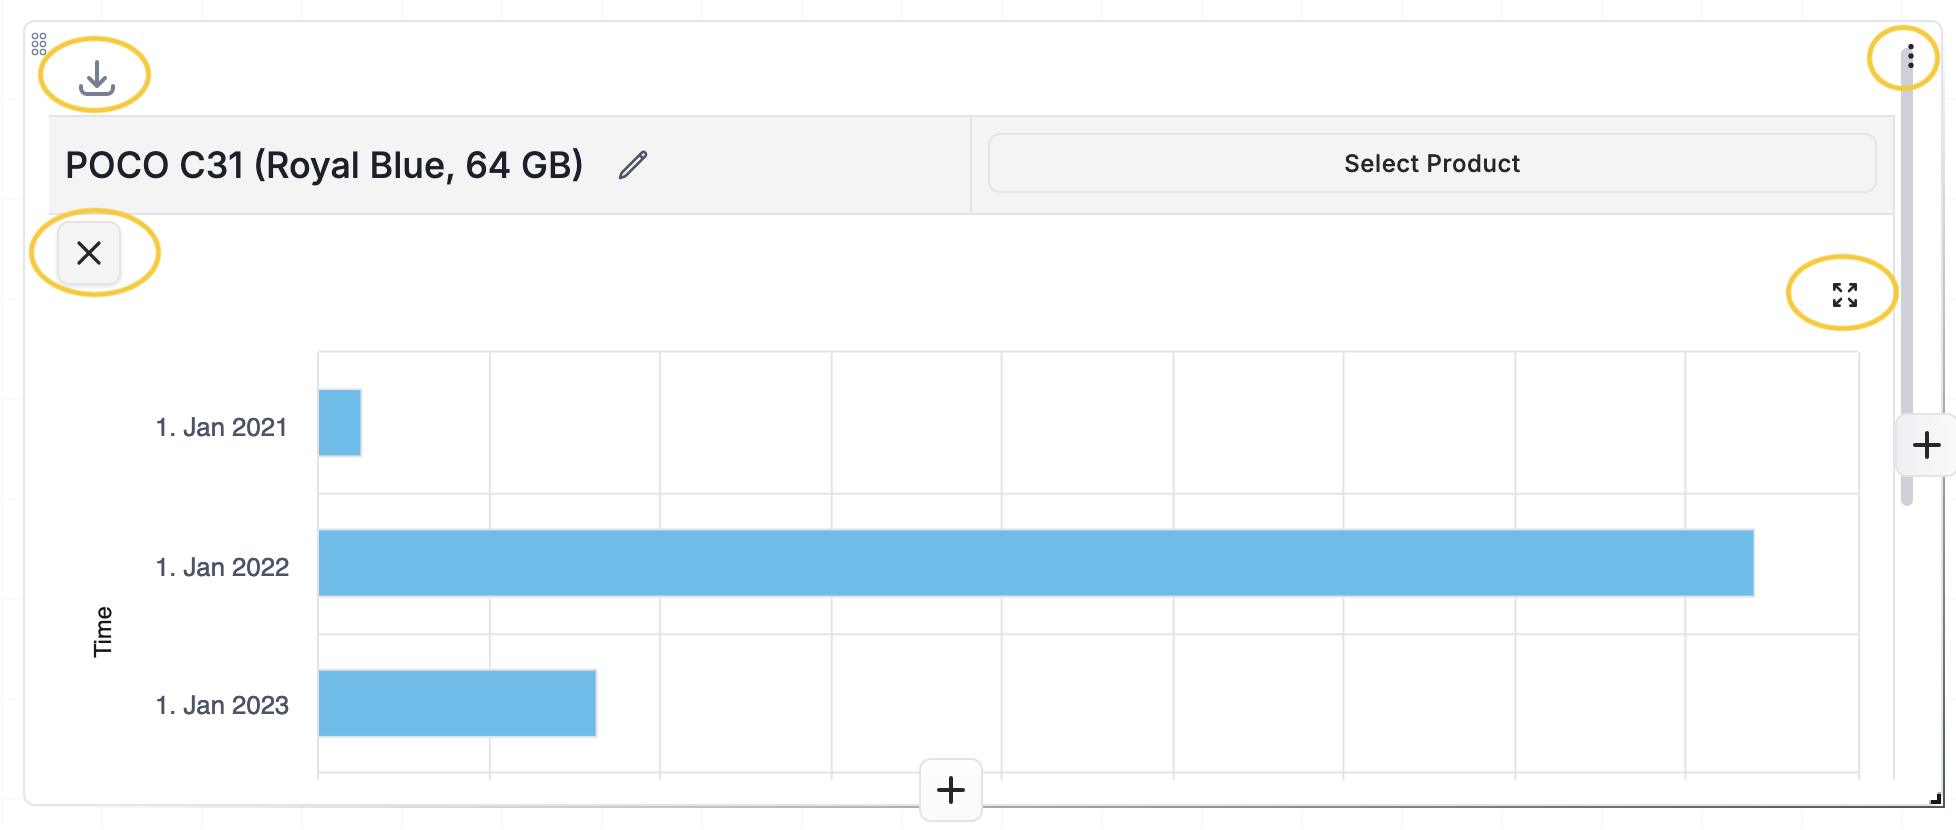
Add Compare Widget:
-
Open the template report you wish to edit.
-
Click on the “Edit” button.
-
Click the down arrow next to “Add Widget” and select “Compare Widget”.
-
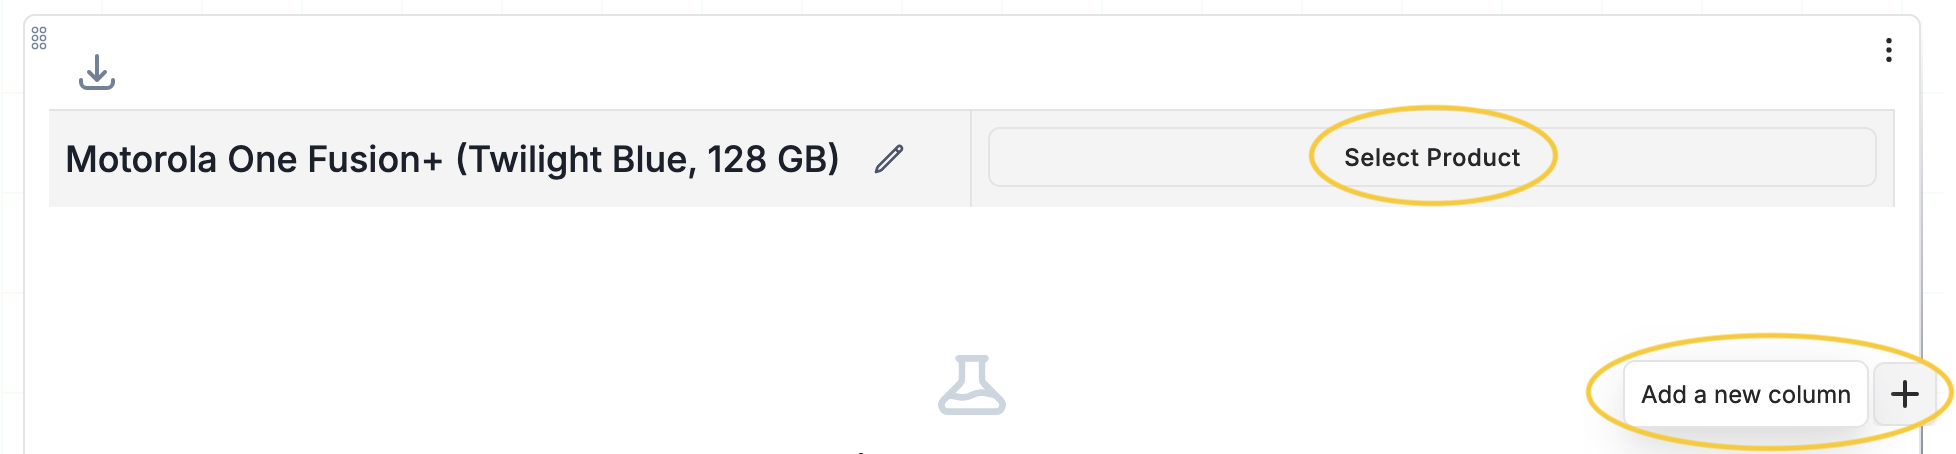
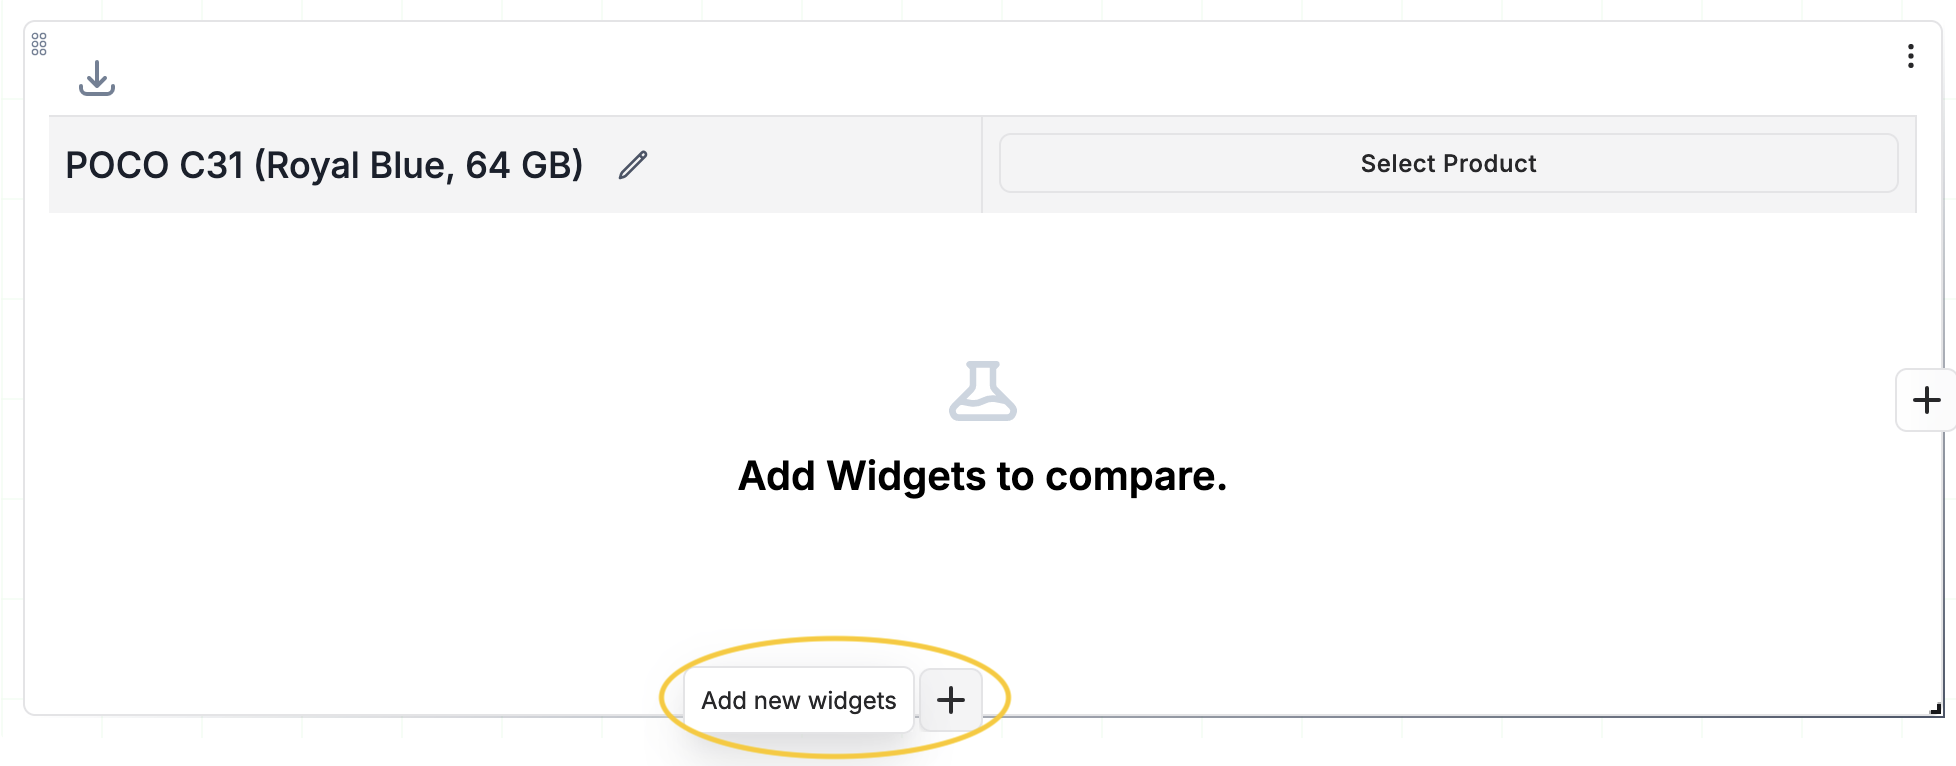
The Compare Widget will be added, with the current product pre-selected.
Adding Products for Comparison:
-
Click “Select Product” to add additional products to compare.
-
Click “Add a new column” to add more product columns.
-
Repeat the selection process to compare multiple products.
Adding Widgets:
-
Click on “Add new widgets”.
-
Select existing graph widgets to compare the products.
-
You can add multiple widgets to the ‘Compare Widget’ for comparison across various metrics.
Additional Features:
-
Export Data: Click on the ‘Export’ button to export data in CSV format.
-
Expand Graph: Click on the ‘Expand’ button within the widget to enlarge the graph.
-
Remove a Graph Widget: To remove a specific graph widget, click on the ‘X’ button on the graph.
-
Delete Compare Widget: To delete the entire compare widget, click on the ****ellipsis (⋮) button and select ‘Remove Widget’.