Topics Report
The Topics Table provides a breakdown of customer sentiment (Positive, Negative, Neutral, Questions, Suggestions) categorized by various topics (specific things customers talk about in their feedback). This helps you understand what aspects of your product or service are most appealing to your customers and where there might be areas for improvement.
Accessing the Topics Report
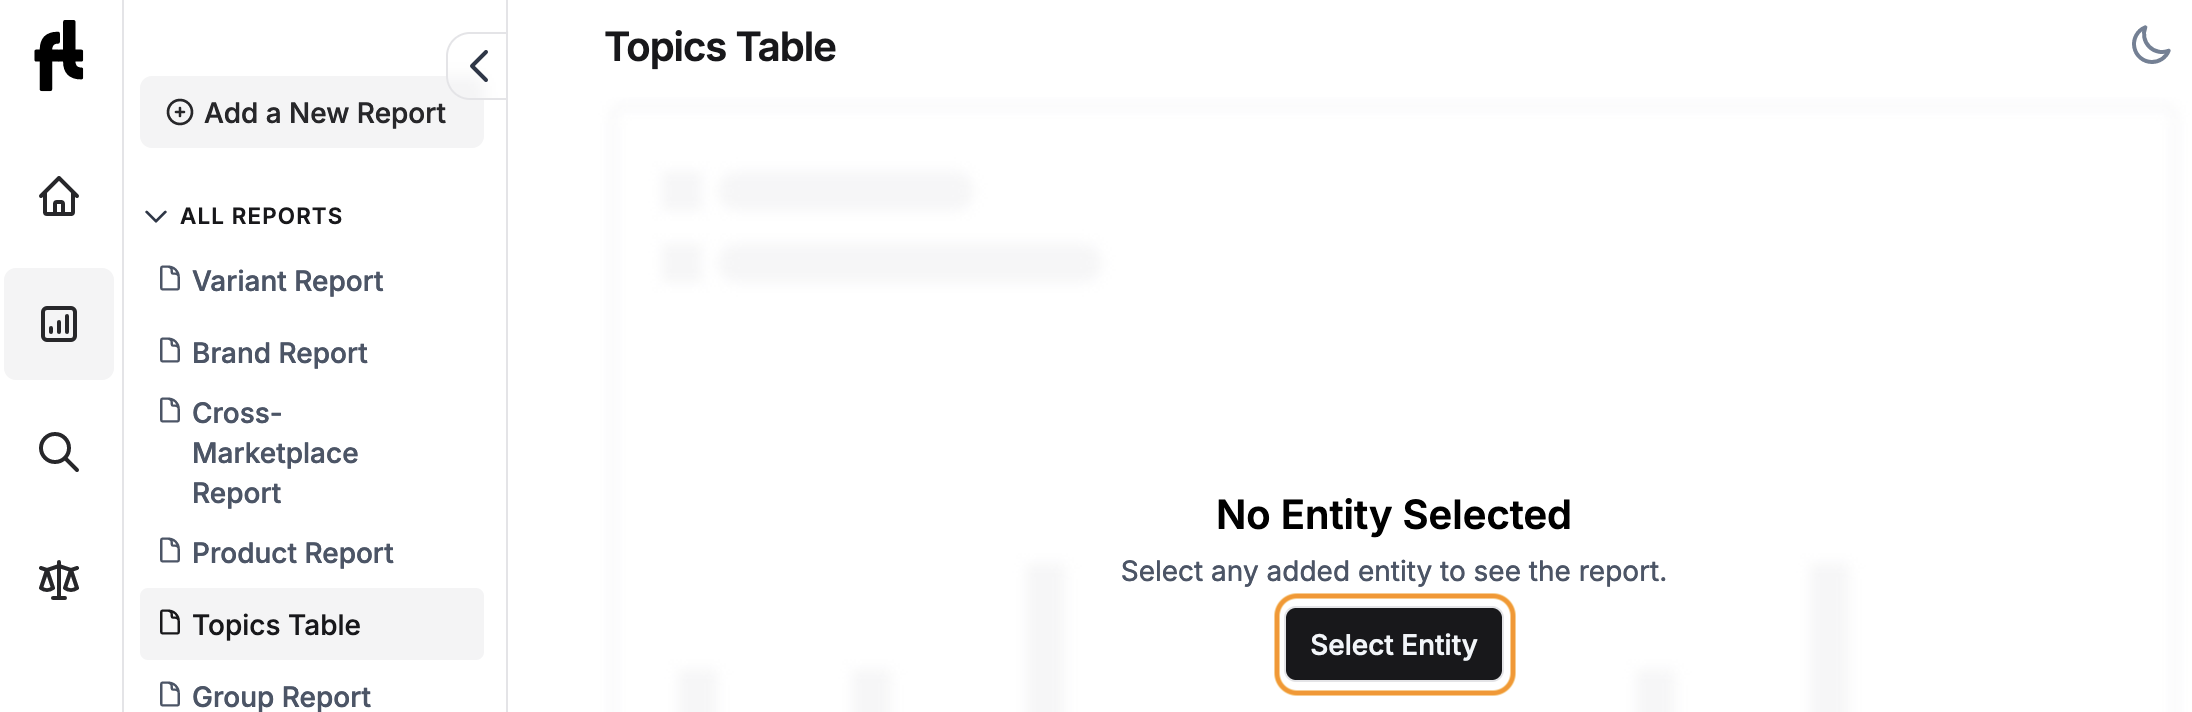
- Go to “Reports”.
- Click on the “Topics Table” from the list of reports on the left-hand side (LHS) panel.
- Click on “Select Entity” to select the source from the search model.
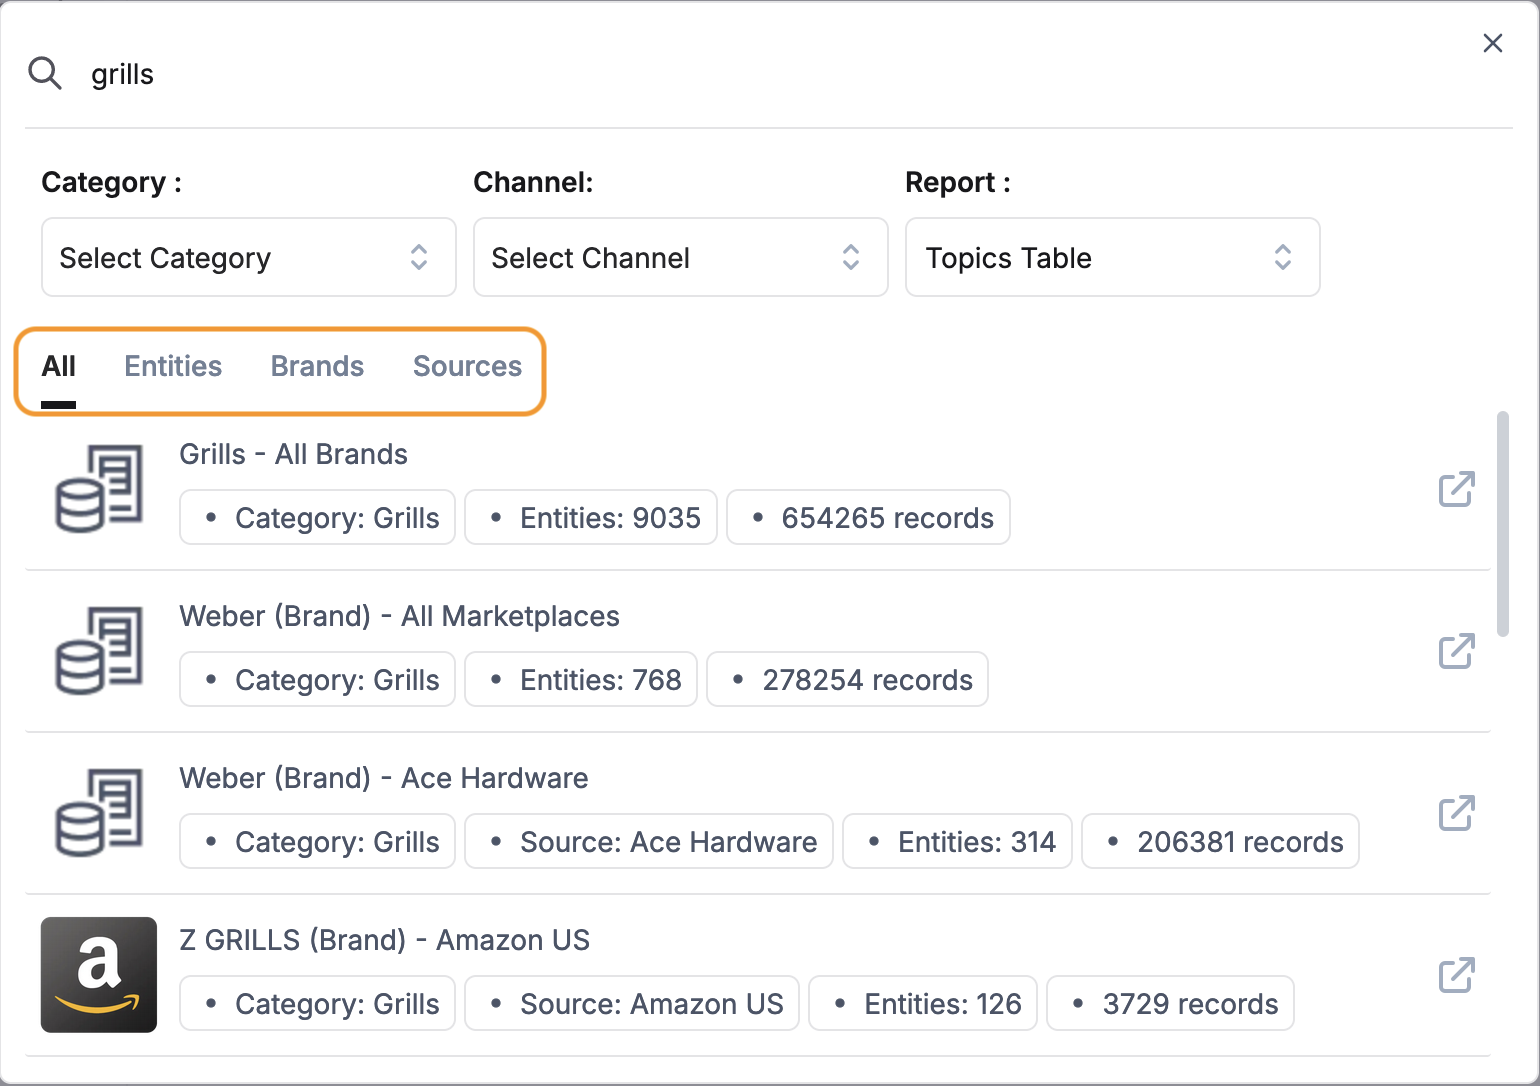
- Search for the specific source you want to analyze by entering a name or keyword in the search bar, browsing by category and channel, or exploring all sources under the "All" tab. Further refine your selection by entity (individual SKUs or variant groups), brands, or user-created groups using the corresponding tabs. Select the desired source.
Key Elements of the Topics Table
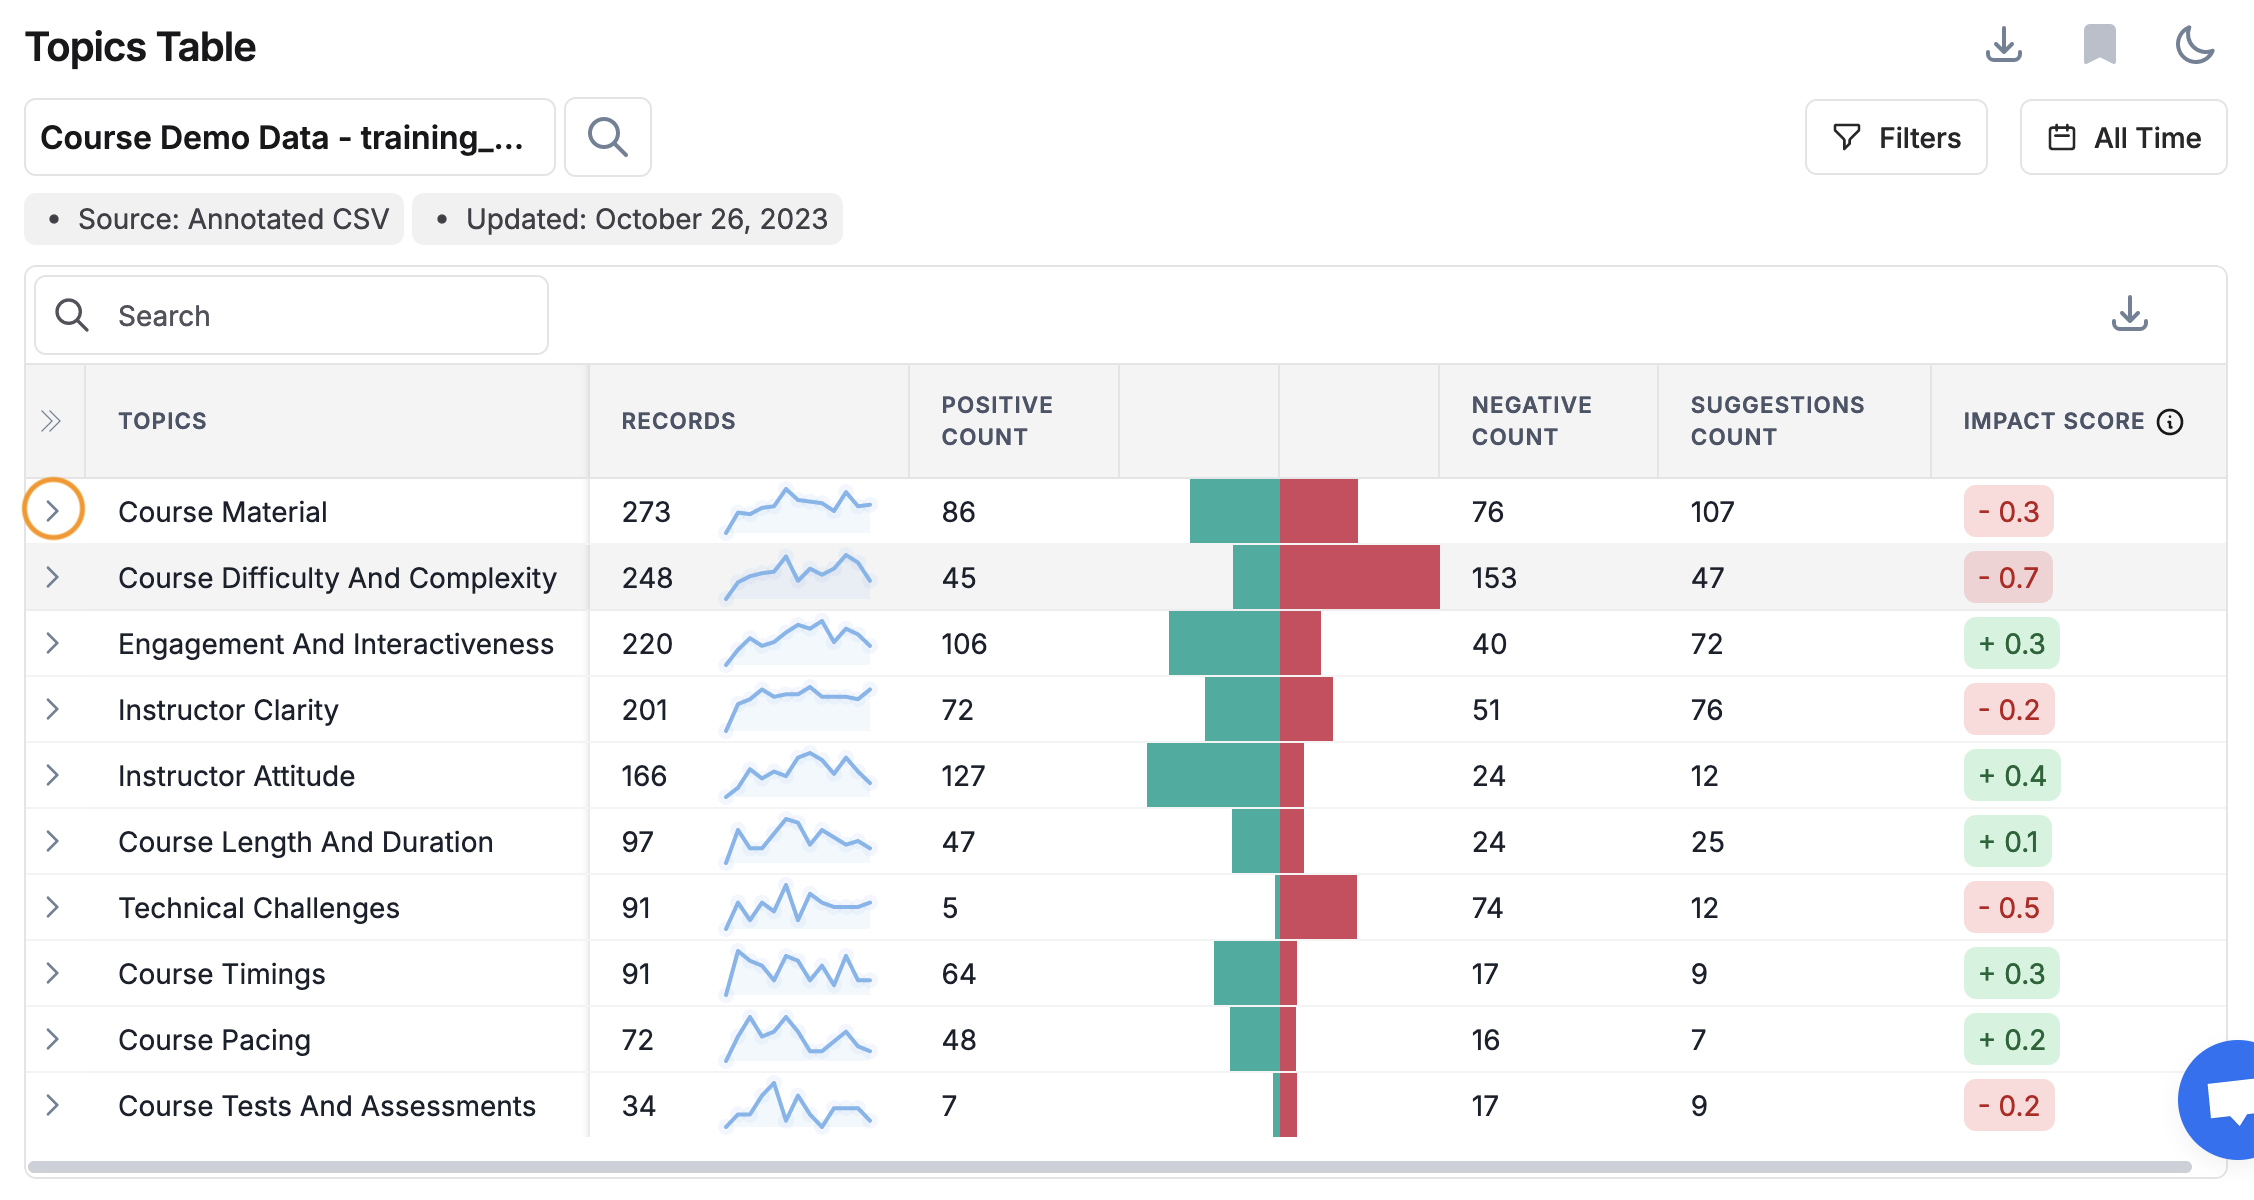
The Topics Table provides a clear view of customer sentiment for your chosen source. Here's a breakdown of the key elements displayed:
| Topics | These are the specific subjects customers are mentioning in their feedback related to your product. (e.g., Sound, Battery, Customer Service, Warranty, etc.). Clicking on the arrow reveals phrases or sub-topics associated with that topic. |
| Records | This indicates the total number of mentions for each topic. |
| Line Graph | The line graph provides a quick look at how discussions about each topic have changed over time. |
| Positive Count | The number of records where the topic is mentioned in a positive context. |
| Negative Count | The number of records where the topic is mentioned in a negative context. It helps identify areas of concern or dissatisfaction related to the topic. |
| Questions Count | The number of records containing questions related to each topic. It highlights topics that generate inquiries or require further clarification. |
| Suggestion Count | This represents the number of customer feedback instances that include suggestions or improvement ideas related to the topic. |
| Impact Score | Indicates the extent to which a specific topic has influenced the overall customer sentiment. |
| Impact Score(eCommerce) | Measures how a topic affects the Average Star Rating of a product. It shows the positive or negative impact (in stars) of each topic on the rating. |
| Bar Graph | Shows the breakdown of positive and negative feedback. |
Functionality and Features
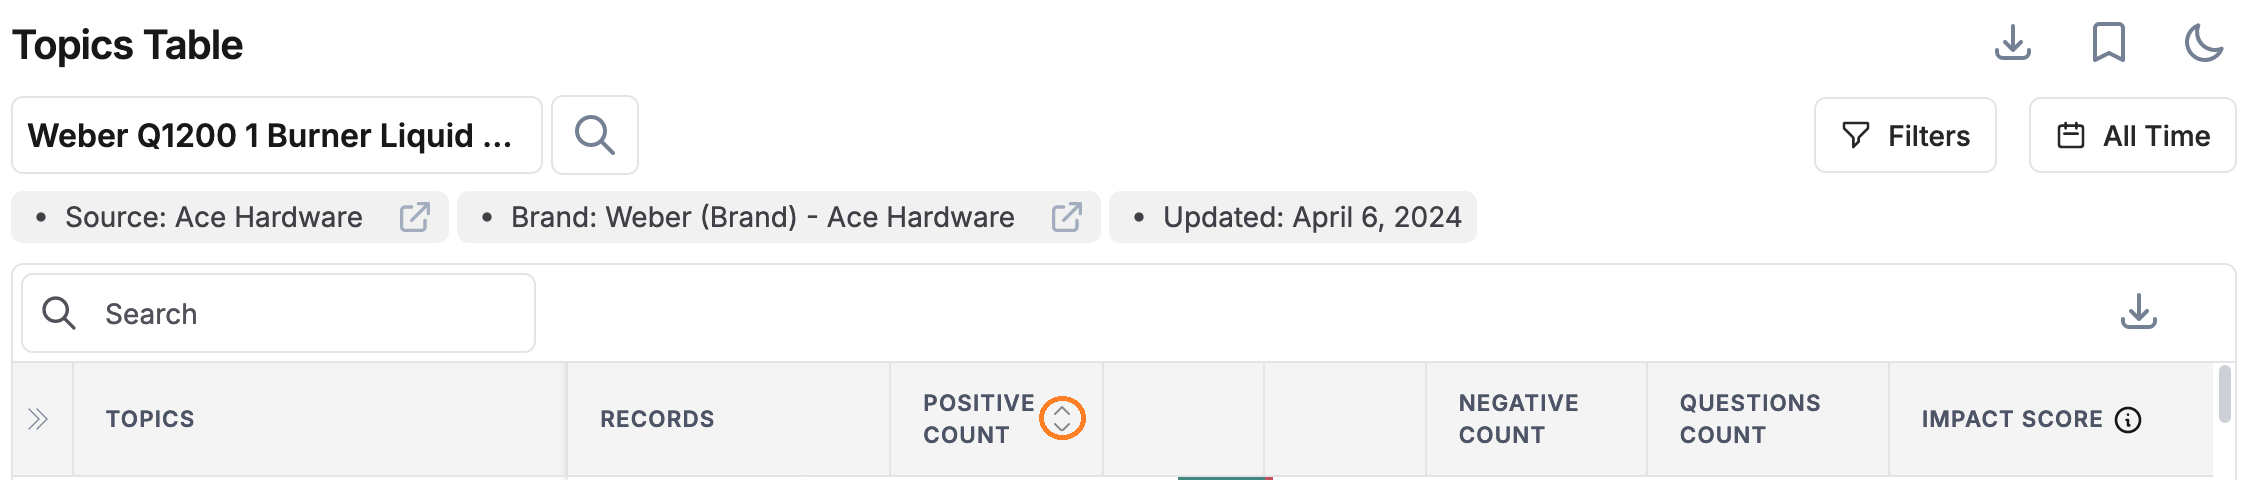
Sorting
Clicking on column headers toggles sorting between ascending and descending order.
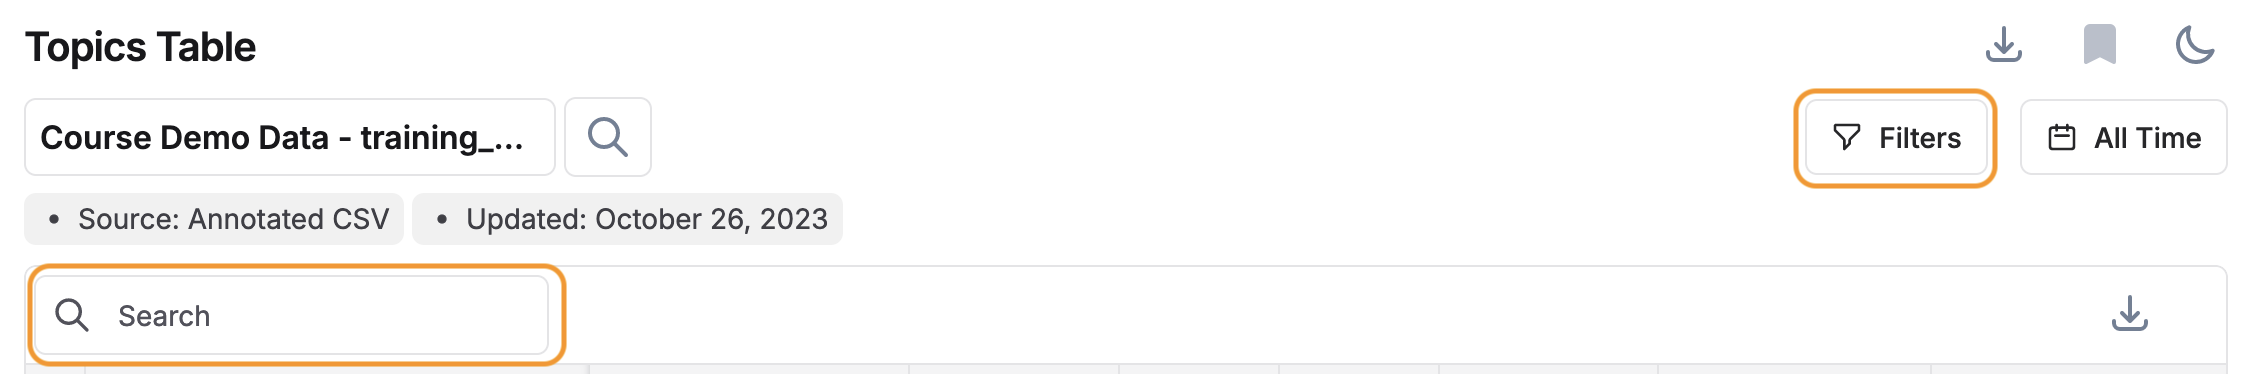
Search & Filtering Options
- The search bar allows users to search for specific topics or phrases.
- Use “Filters” to select timeframes and analyze trends over specific periods like daily, weekly, monthly, or custom date ranges. Additionally, the filters provide various options for refining the data further.
Drill Down into Topic Reviews
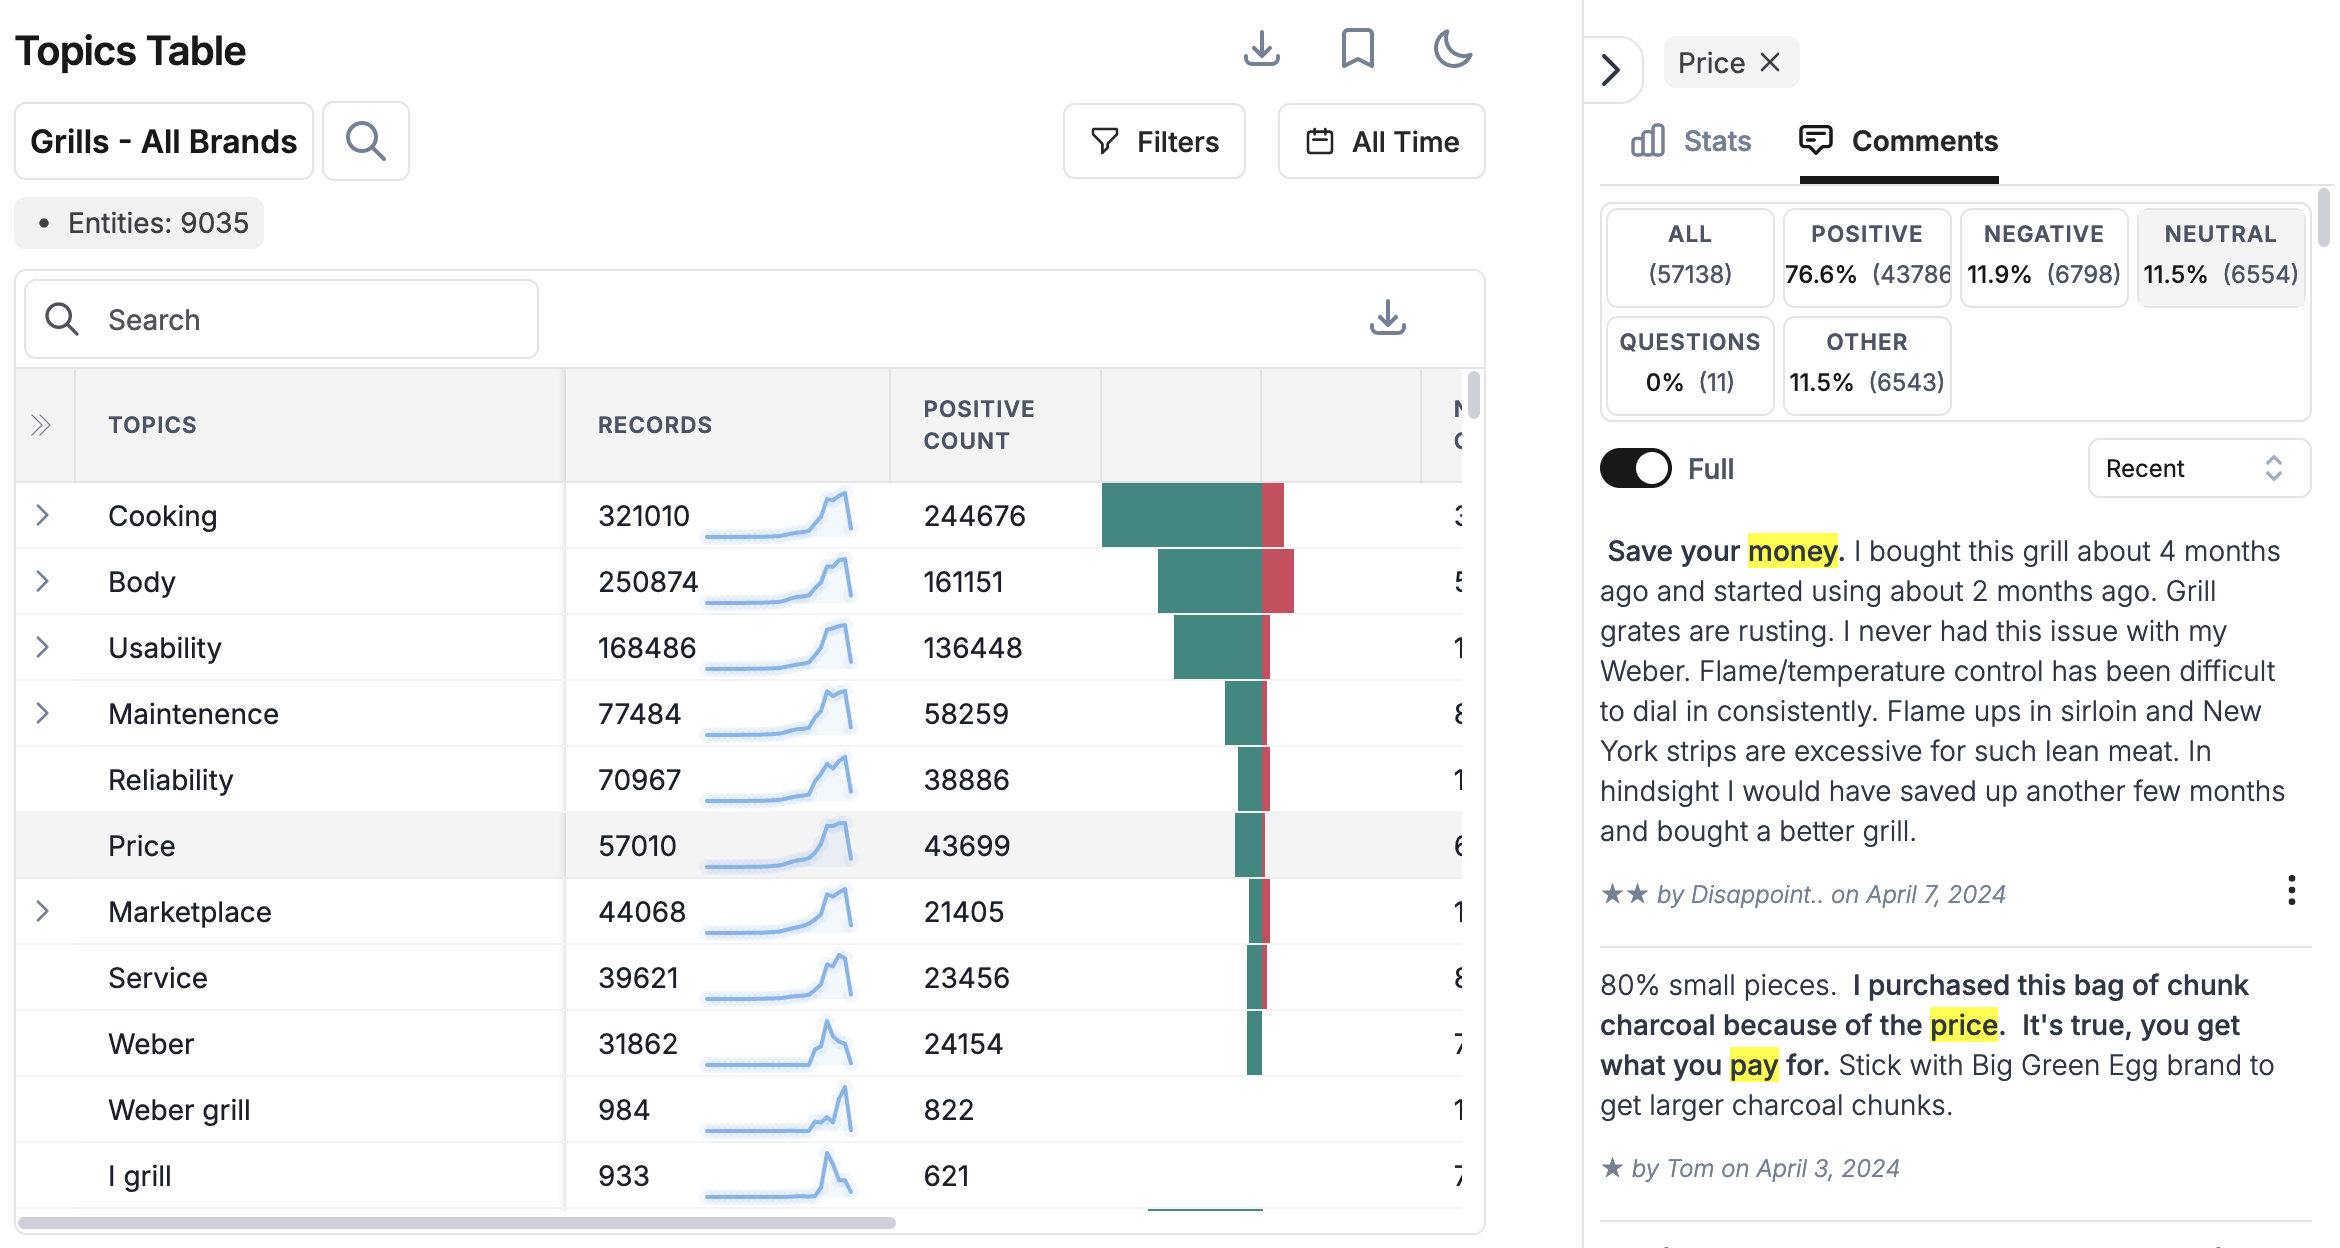
Clicking a topic or phrase within the Topics Table opens a window on the right-hand side (RHS) with all the reviews that mention the selected topic or contain the chosen phrase.
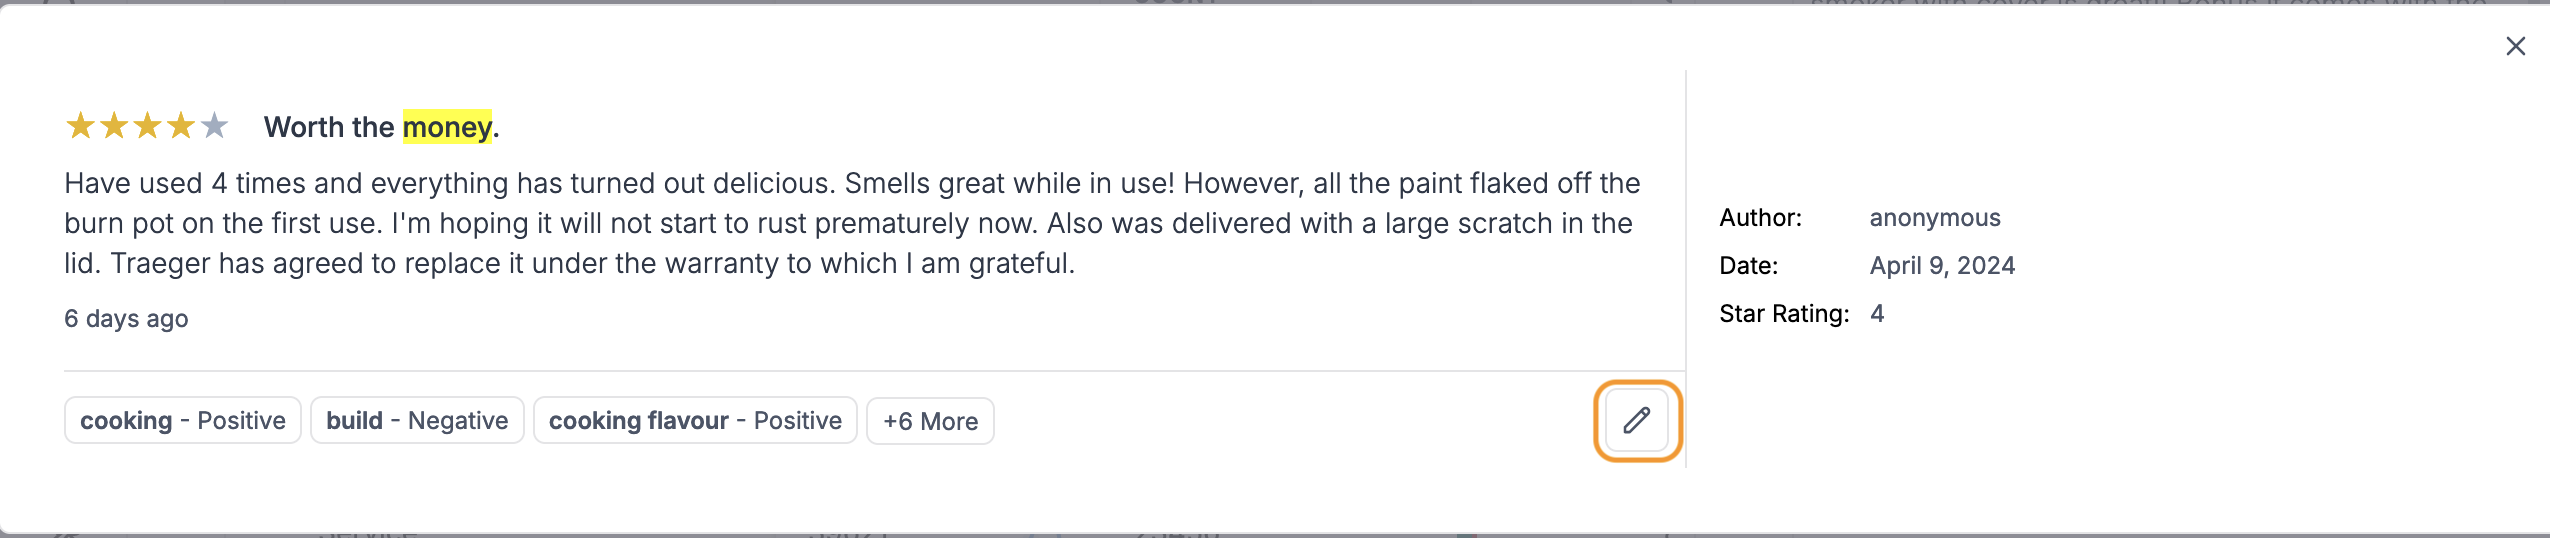
Clicking a review opens a pop-up window displaying the complete review text and topics related to it. Additionally, the date the review was submitted is shown on the right-hand side (RHS) of the window. Add or remove topics by clicking on the edit icon.
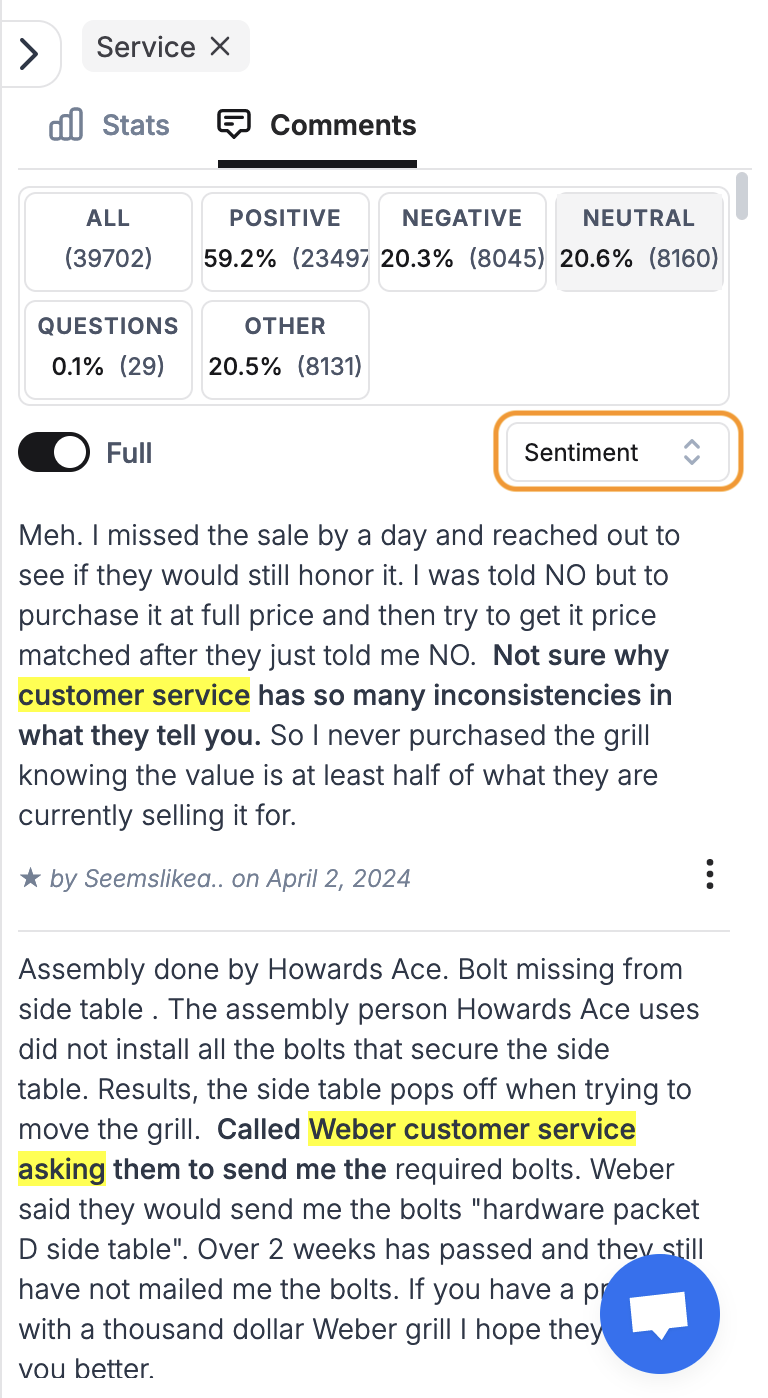
Comments
Sentiment Tabs
Users can access specific subsets of reviews by clicking on the following tabs:
- All: Total number of records that mention the selected topic or phrase.
- Positive: The number of records containing positive sentiment phrases.
- Negative: The number of records containing negative sentiment phrases.
- Neutral: The number of records with neutral sentiment(neither positive nor negative). This is further divided into:
- Questions: The number of records containing questions.
- Suggestion: The number of records containing suggestions or improvement ideas related to the topic.
- Other: The number of records which are classified as neutral, but not questions or suggestions.
Sorting-Reviews
Use the dropdown menu to sort reviews by sentiment, recent, or popularity.
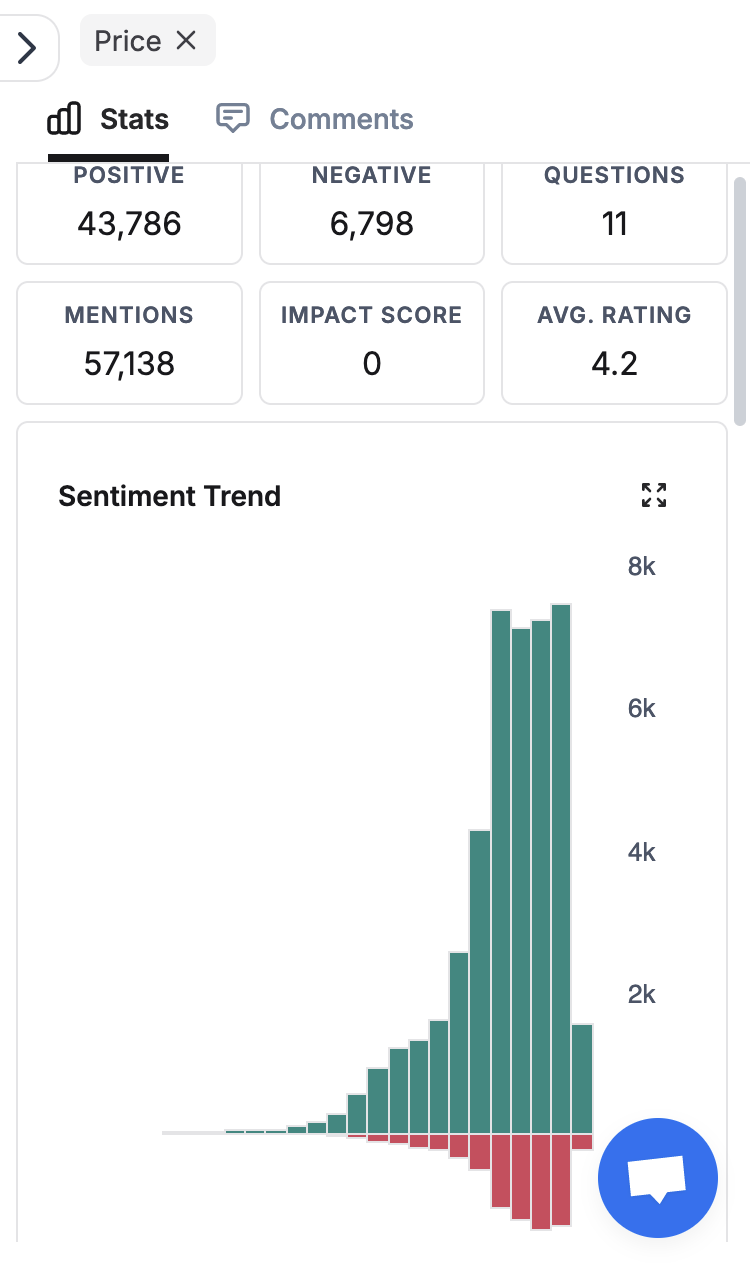
Stats
This section provides insights for your chosen topic or phrase with various graphs:
- Sentiment Trend: This graph tracks how sentiment (Positive and Negative) changes over time.
- Mentions Trend: This graph shows how mentions of the topic fluctuate over time.
- Mentions Compared to All Records: This graph compares the number of mentions to the total number of records, to gauge its relative importance compared to other topics.
- Match Percentage in Each Time Period: This graph shows the percentage of records within each time frame (daily, weekly, etc.) that mention the selected topic or phrase.
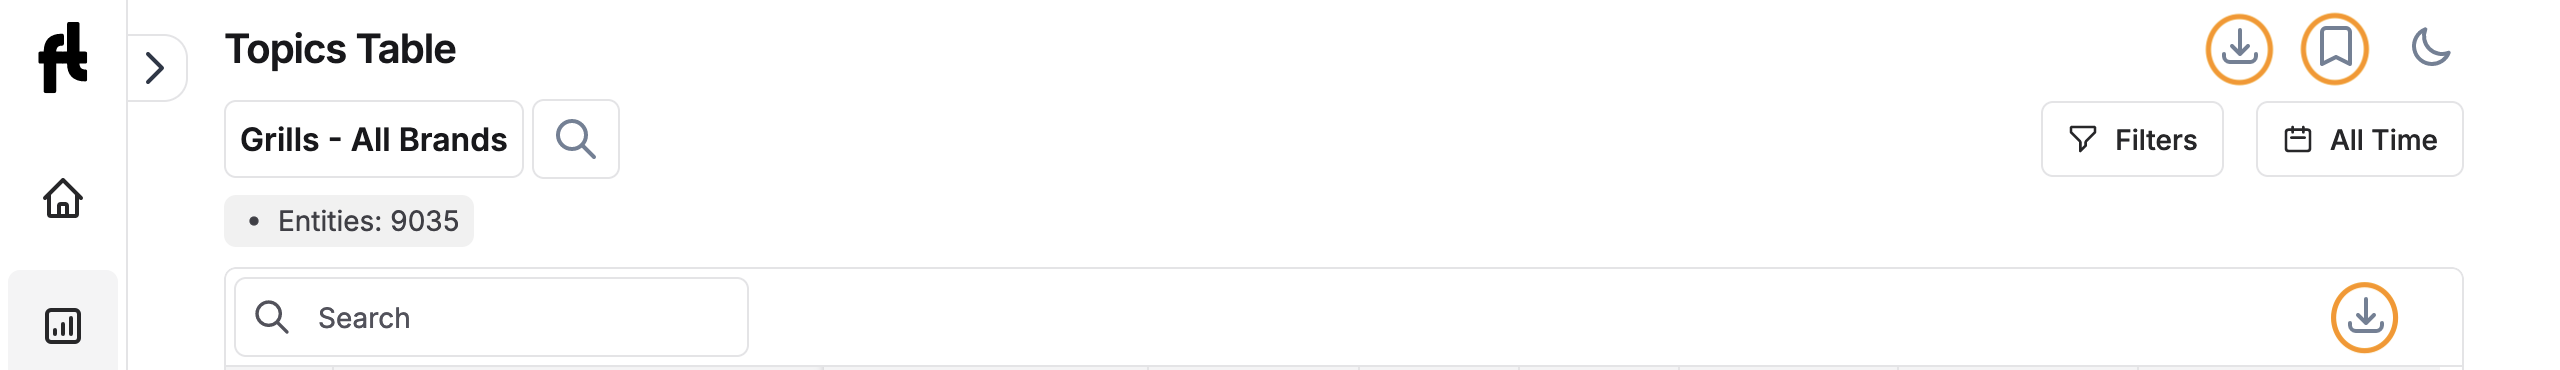
Bookmark & Download
You can bookmark the report for easy access from the homepage and download it as CSV or PPT for further analysis.