Compare
This feature enables you to compare and contrast trends and insights.You can conduct side-by-side comparisons of up to 10 products, entities, or data sources across various brands, marketplaces, and geographical locations.
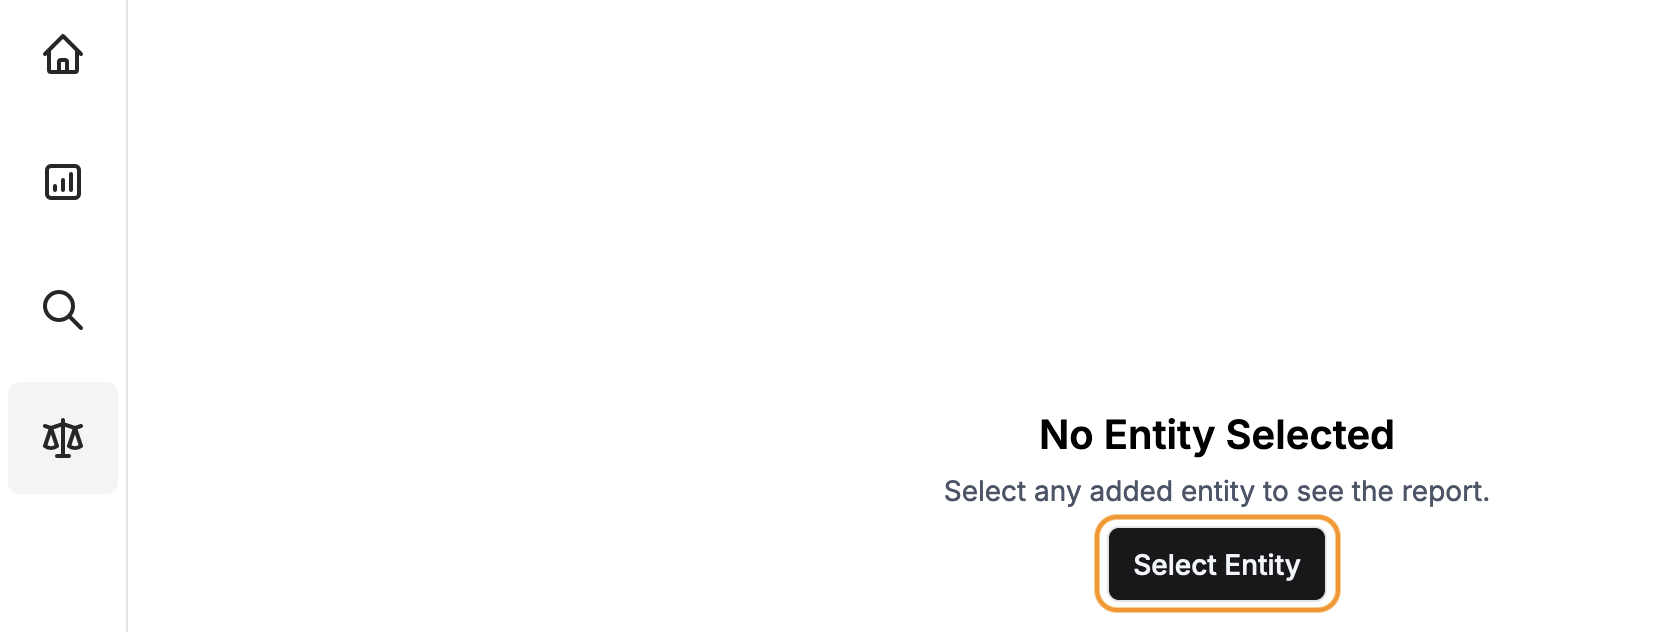
- Click on “Compare” on the side panel.
- Click on “Select Entity” to select the product from the search model.
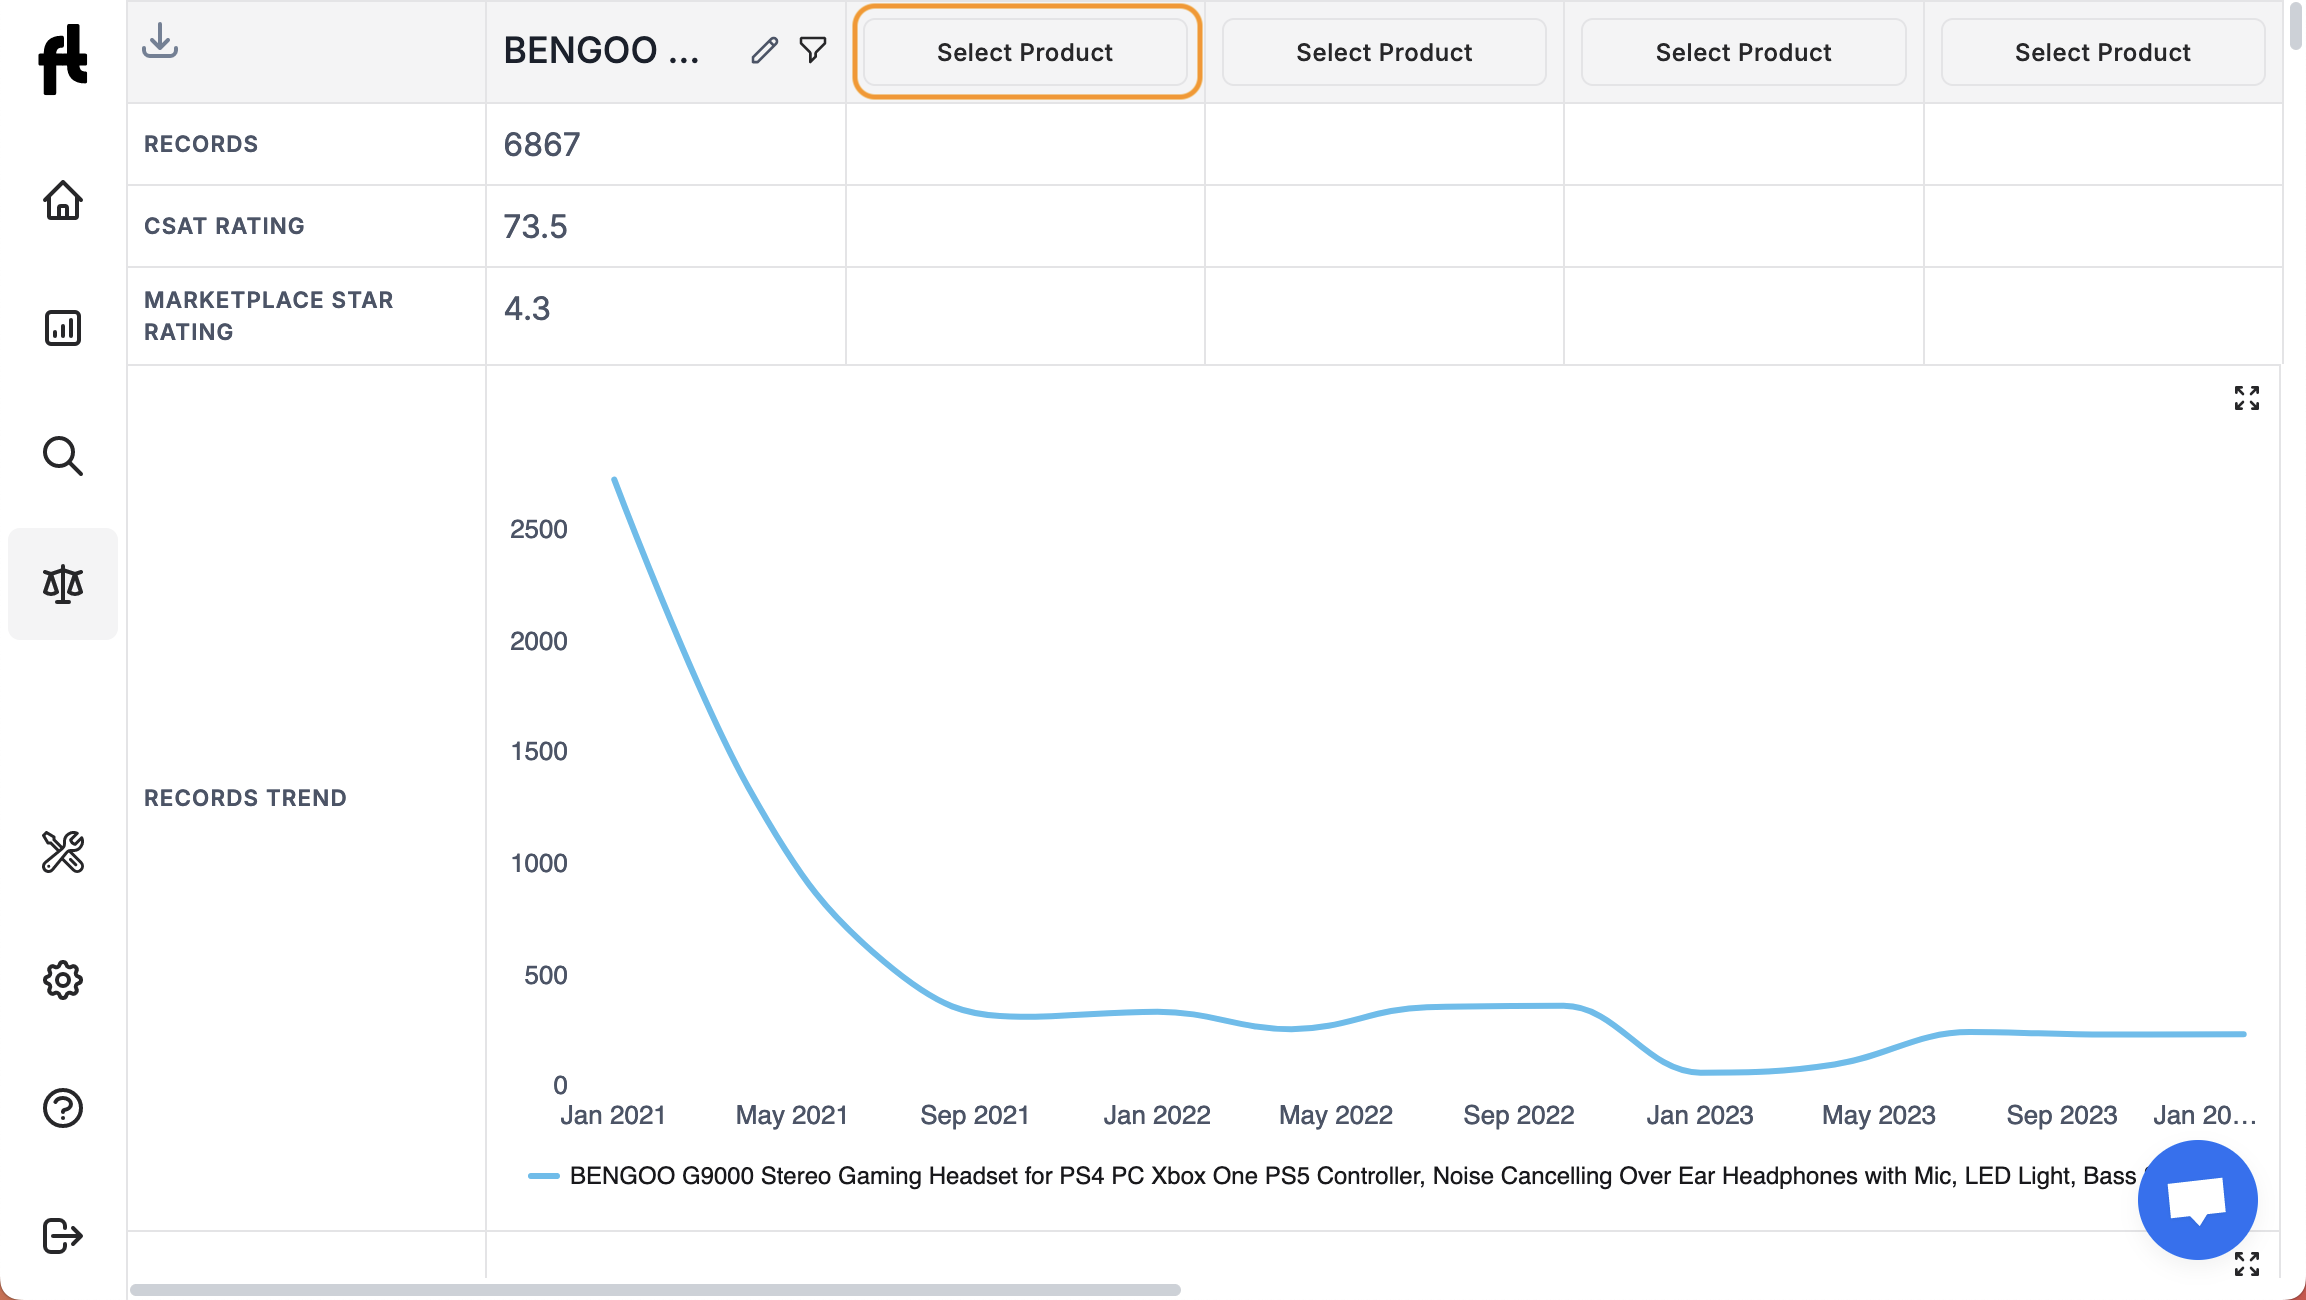
To add more products click on “select product”. You can add up to 10 products.
Comparison Metrics
Records
Represents the total number of reviews associated with each product.
CSAT Rating
Measures customer satisfaction with a product or service based on their recent experiences. For more details, go to Customer Satisfaction Score (CSAT)
Marketplace Star Rating
Rating of the product on the retailer. For an individual product, this will be the exact rating that you see on the retailer / marketplace. For a group or brand, this metric will be an average of the ratings of the individual products in that group.
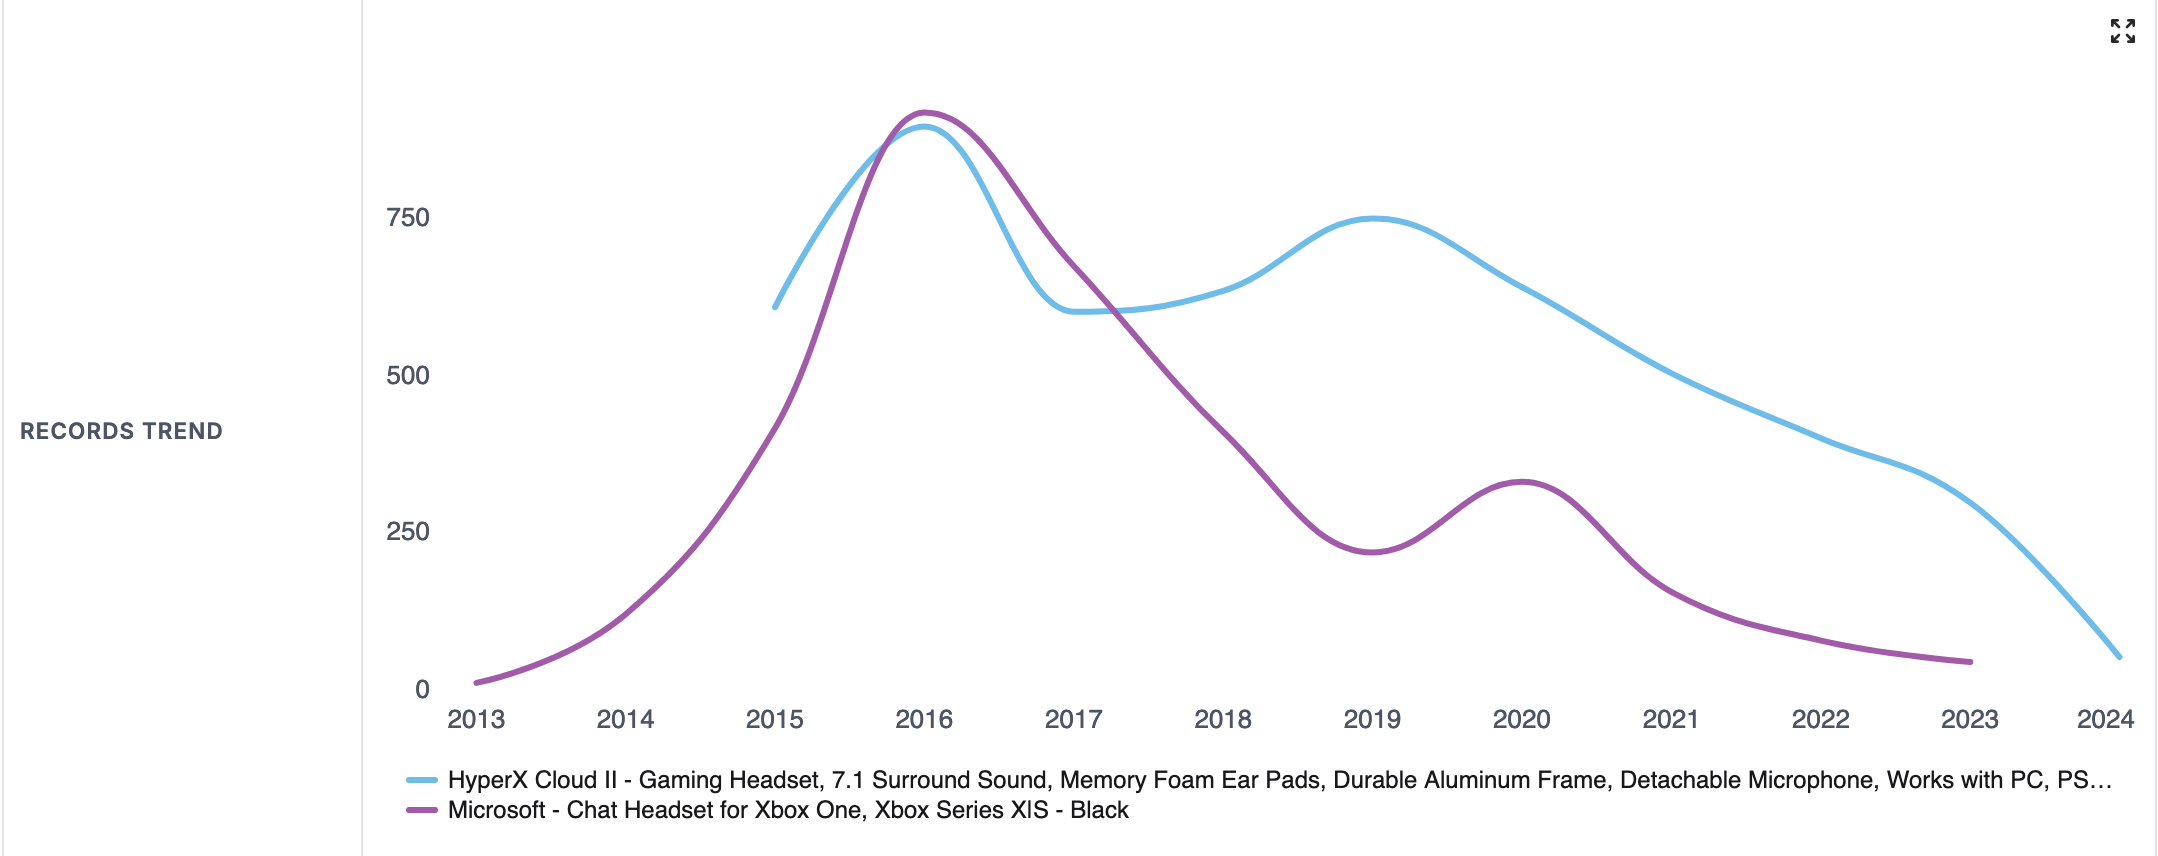
Records Trend
The graph compares the volume of reviews over time for multiple products, allowing you to identify trends in customer engagement. The X-axis represents time in years, and the Y-axis represents the total number of reviews.
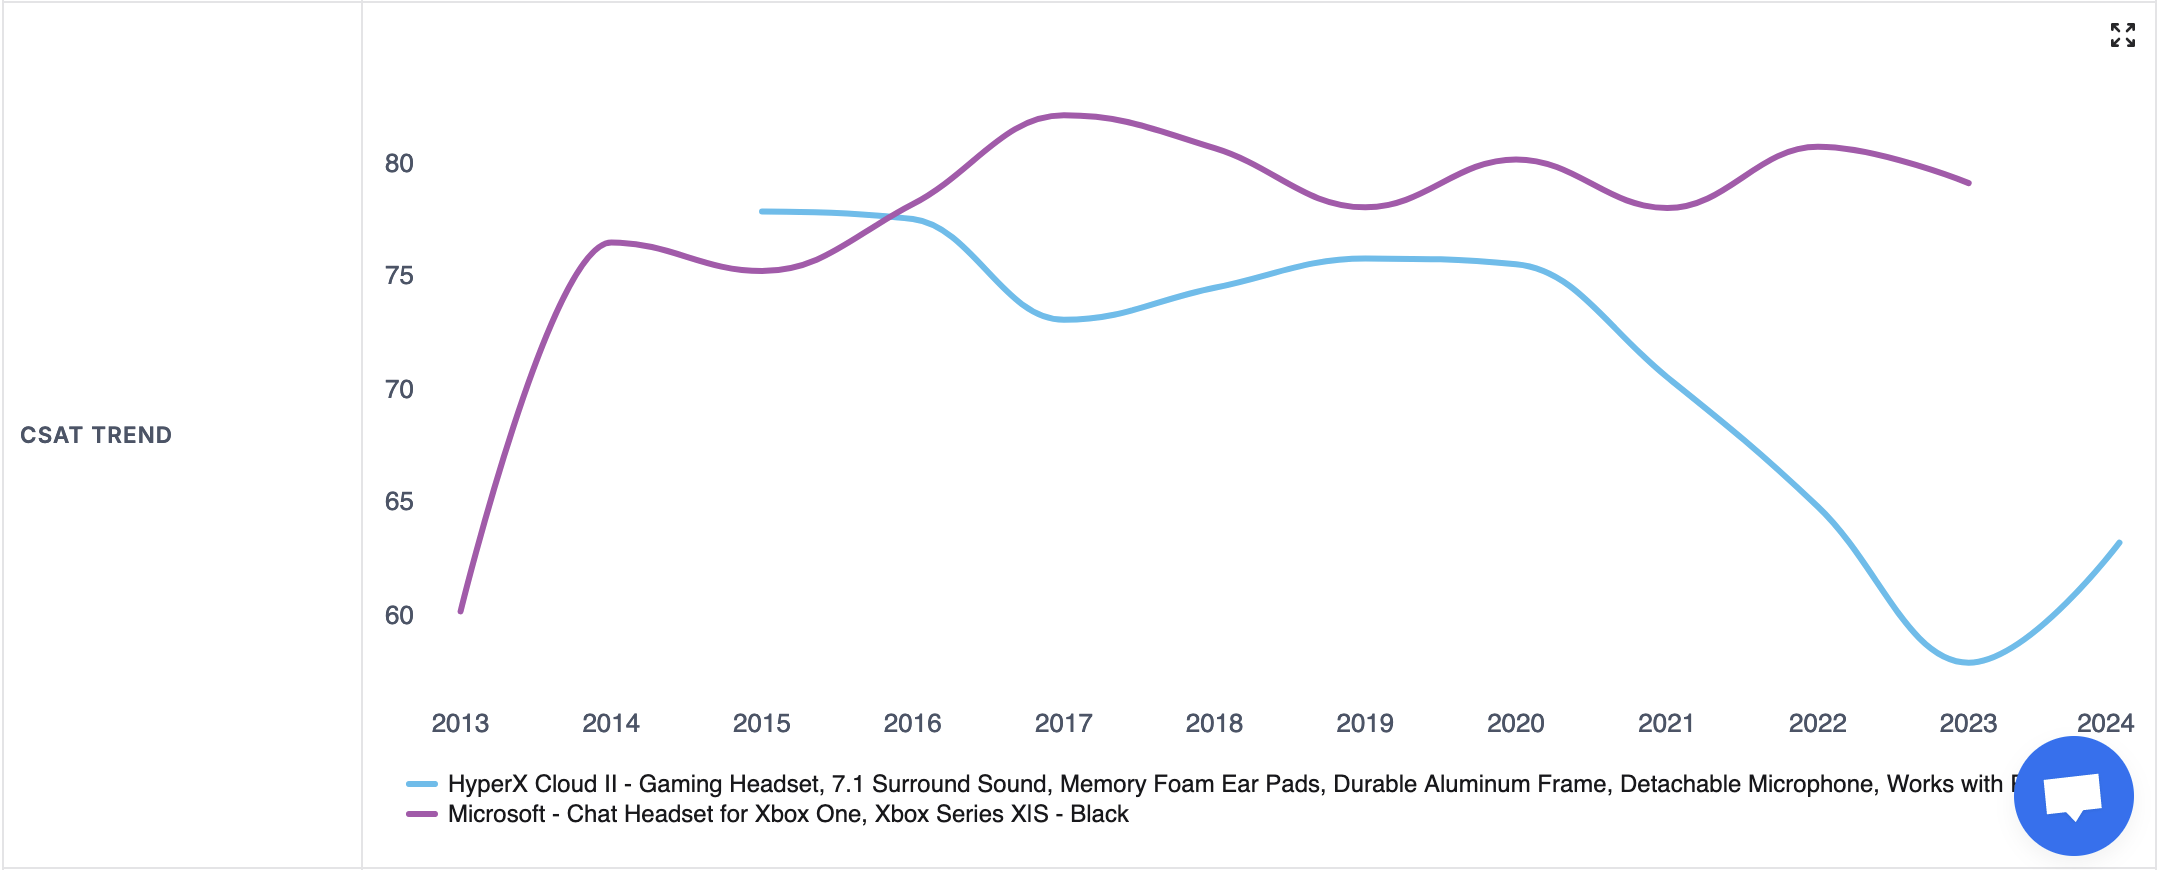
CSAT Trend
The graph provides a visual comparison of CSAT ratings among various products over time. The X-axis denotes years, while the Y-axis represents CSAT ratings.
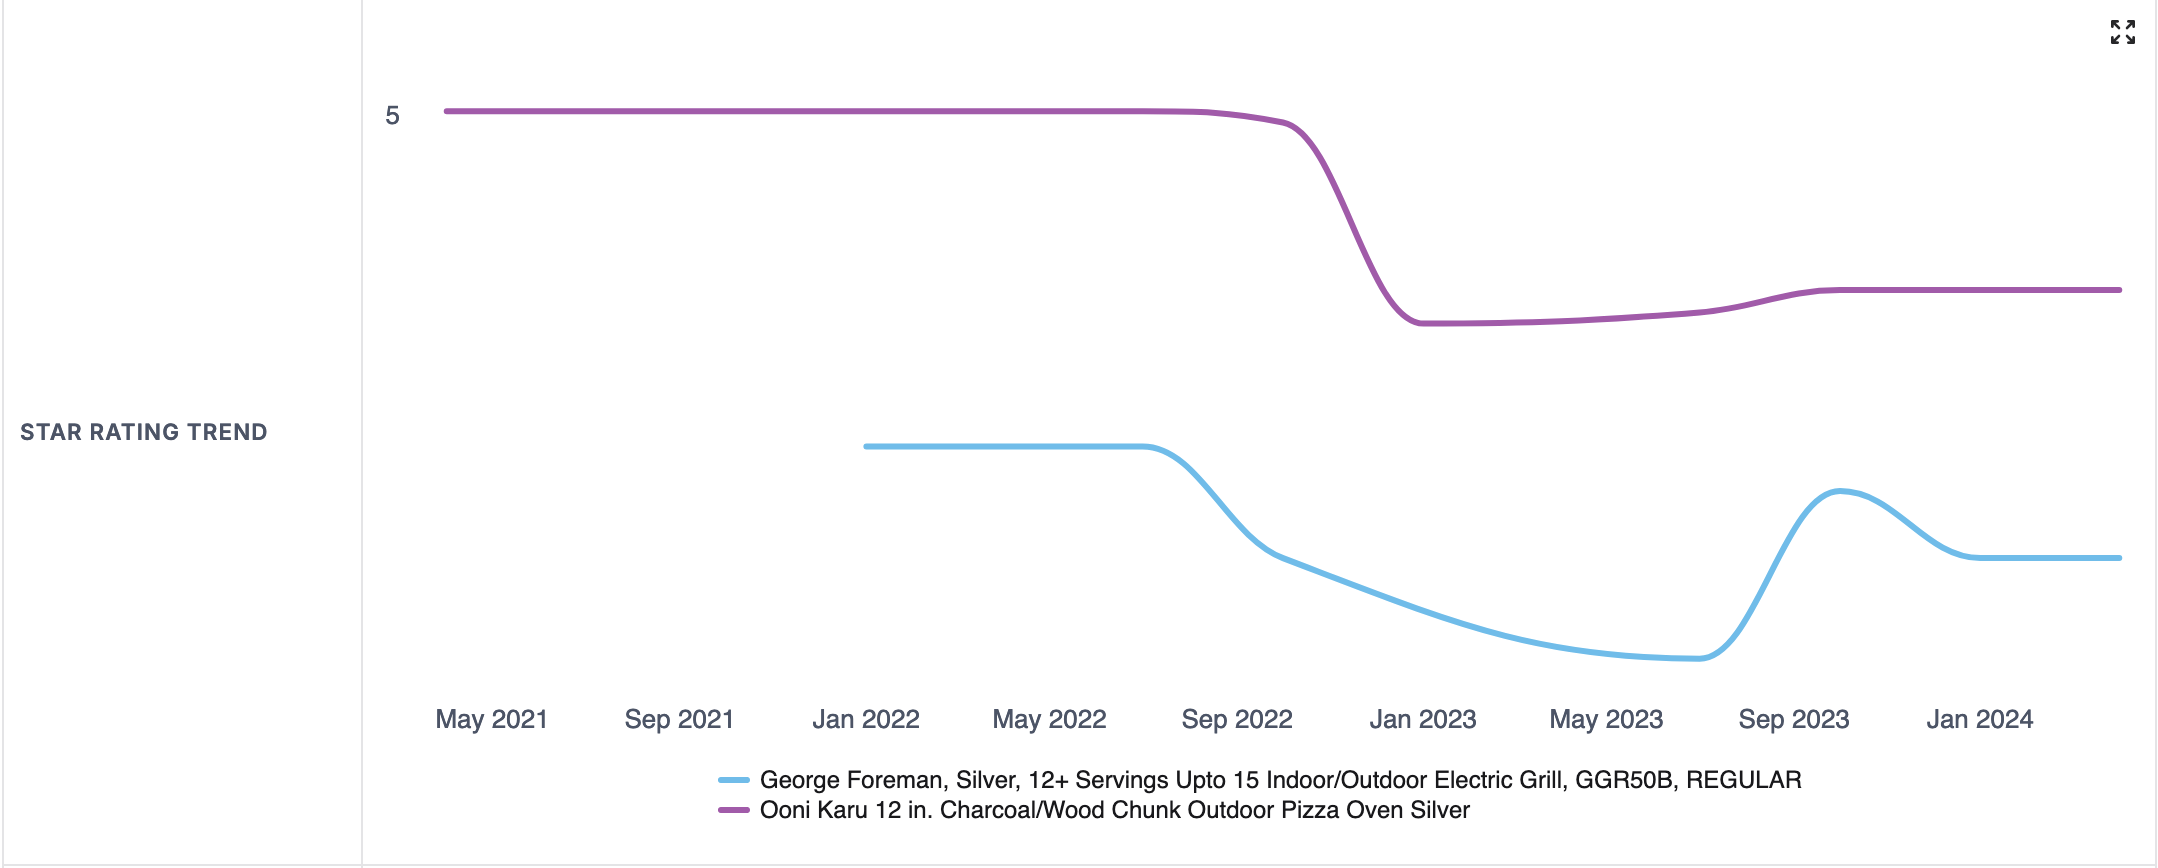
Star Rating Trend
The graph visually compares the star ratings of multiple products over time, showing how ratings have changed over the years. The X-axis represents time in years, while the Y-axis depicts the star rating scale.
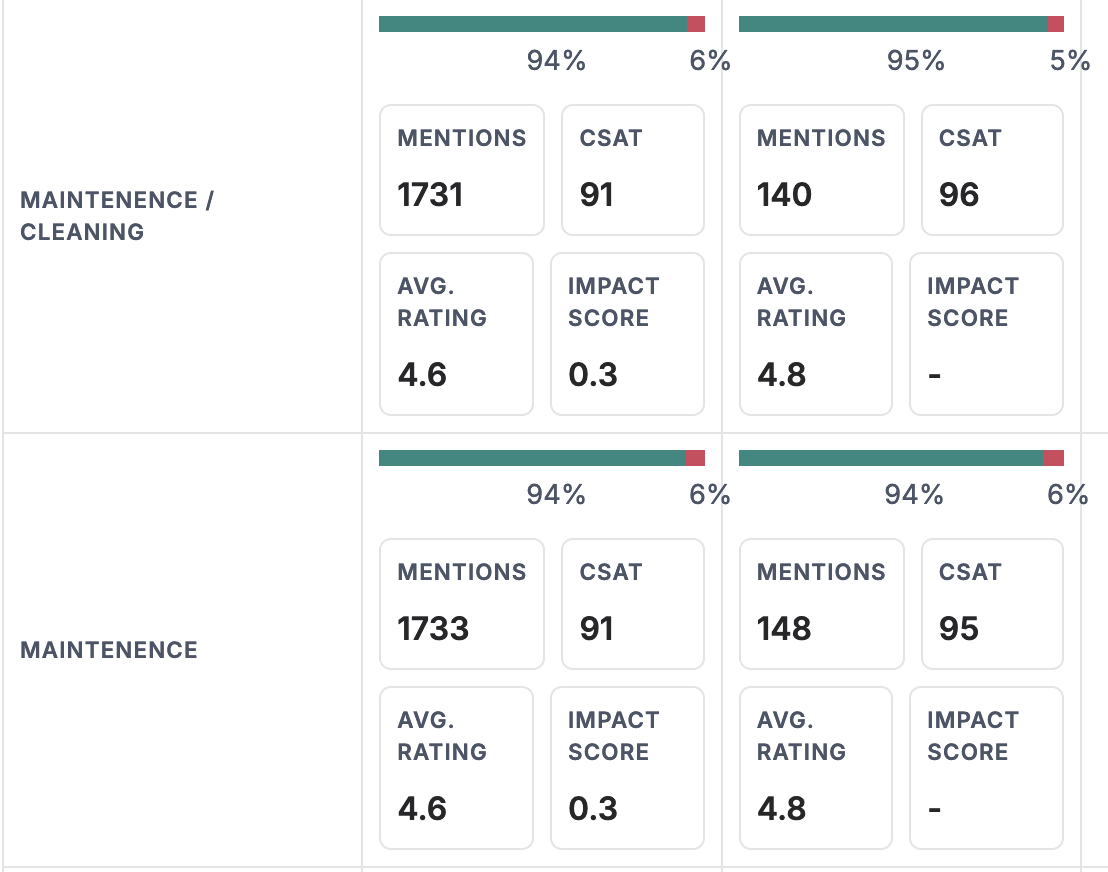
Topic Volume
The graph allows you to compare how often specific topics are mentioned in reviews for different products. X-axis represents these topics and Y-axis represents the number of records mentioning these topics.
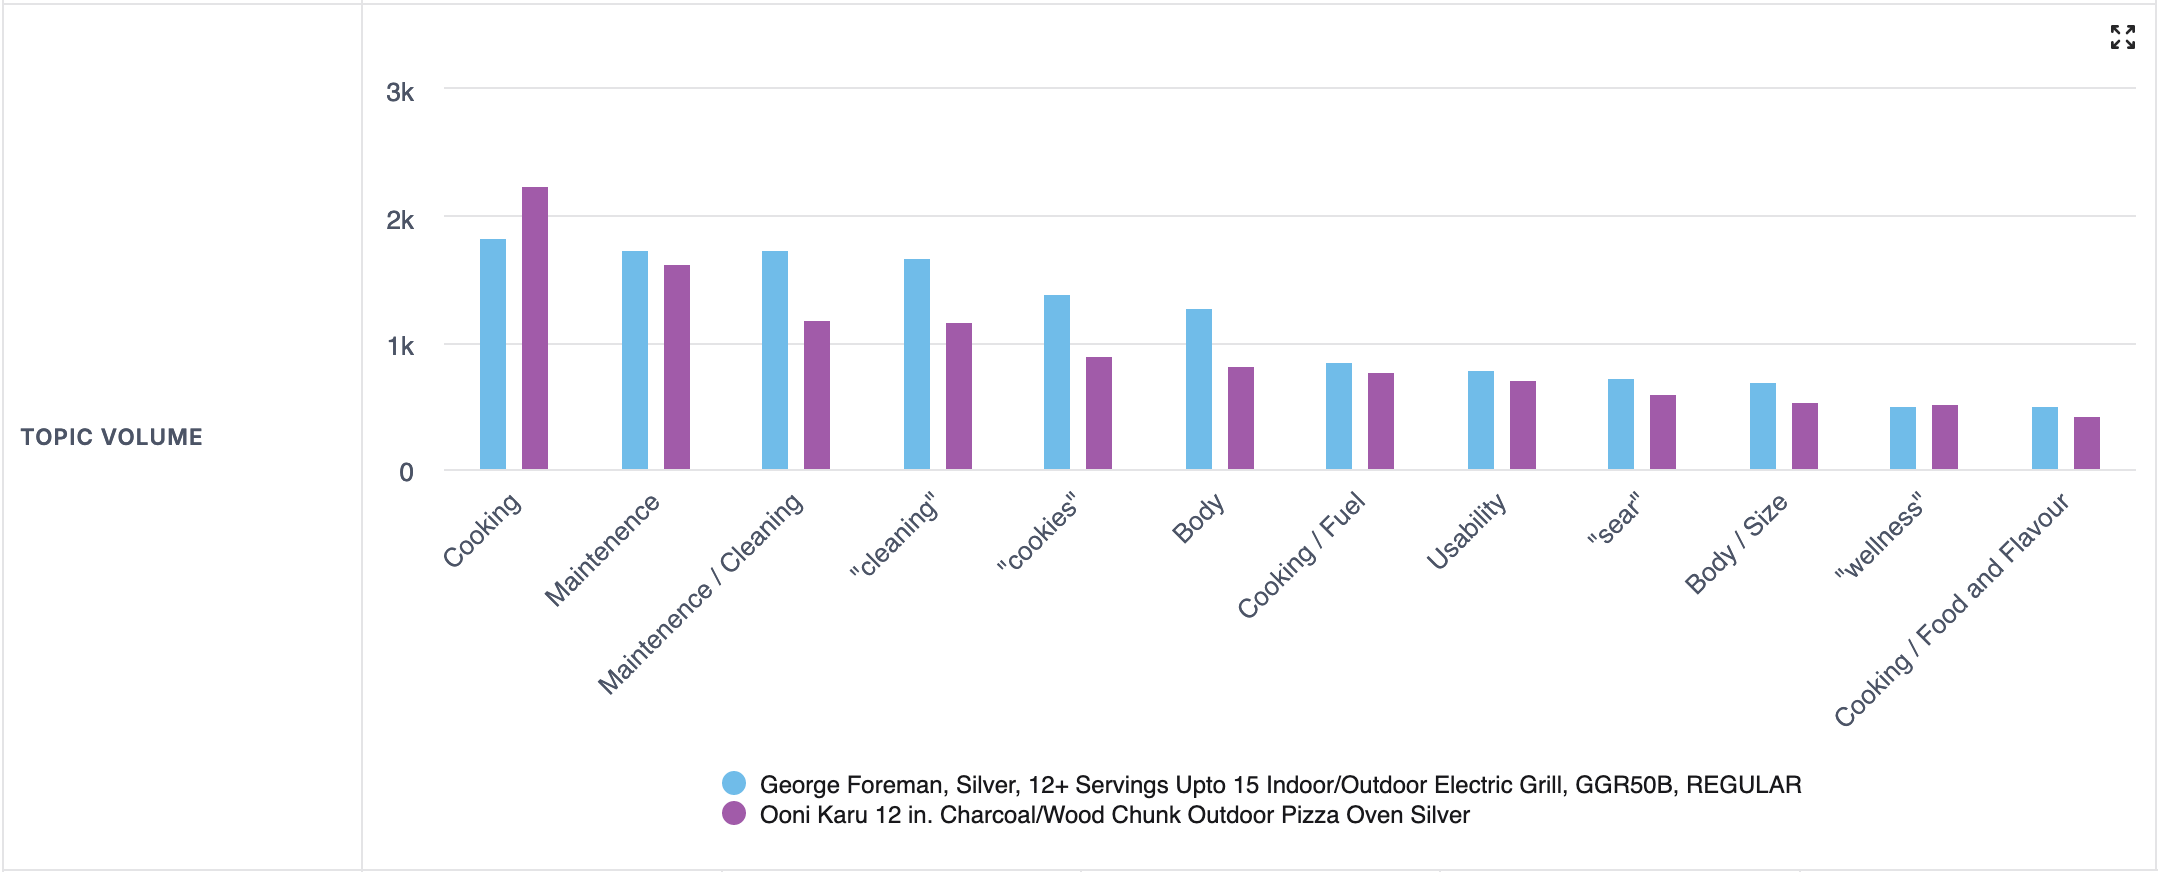
Here you can also view comparisons topic by topic.
- Mentions: Total number of records that mention the topic.
- CSAT: CSAT (Customer Satisfaction Score or Rating) rating for the topic.
- Avg. Rating: Mathematical average of all the ratings that have associated reviews.
- Impact Score: Measures how a topic affects the Average Star Rating of a product. It shows the positive or negative impact (in stars) of each topic on the rating.
- Bar Graph: Shows the breakdown of positive and negative sentiment in percentage.